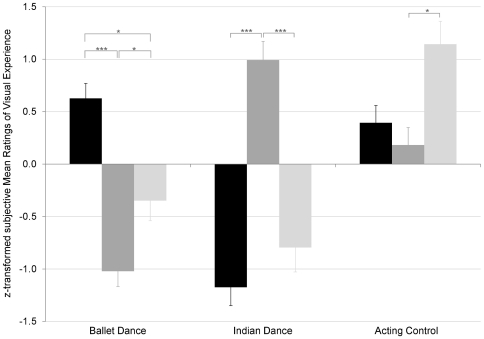
Figure 2. Visual experience for different movement styles.
y-axis: z-transformed ratings of visual experience (mean ± SE). x-axis: visual experience of ballet spectators (N = 12) in black columns, Indian dance spectators (N = 9) in grey columns, and novices (N = 8) in light grey columns for different types of performances (ballet, Indian dance, and acting control). The ratings confirmed our experimental groups: the level of acquired visual experience was dependent on the spectator group. *** = significant at P<0.001, * = significant at P<0.050.

