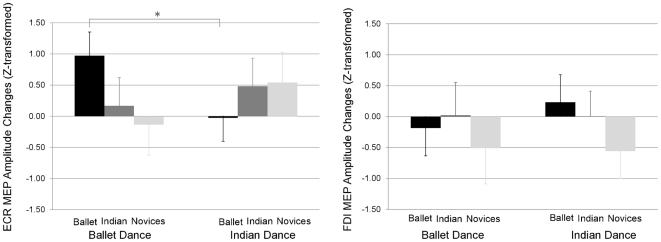
Figure 4. MEP modulation by visual experience.
y-axis: MEP amplitudes (z-transformed, mean ± SE, N = 29) of the forearm (ECR, left figure) and hand (FDI, right figure). x-axis: visually experienced ballet spectators (black columns), Indian dance spectators (grey columns), and novices (white columns) during watching ballet specific movements (left) and Indian dance specific movements (right) performances (each as a contrast to non-dance control performance). * = significant at P<0.050.

