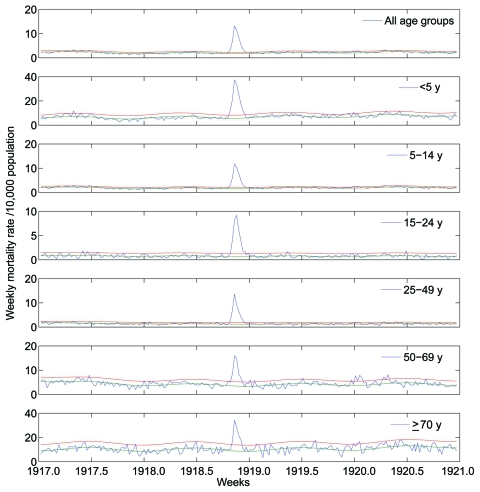
Figure 3.
Age-stratified weekly all-cause mortality rates per 10,000 population in Boyacá, Colombia, 1917–1920. Background mortality rate derived from a seasonal regression model (blue); corresponding 95% CI curves are shown (red and green). Deaths in excess of the upper limit of the background mortality rate curve are deemed attributable to the 1918–19 influenza pandemic.

