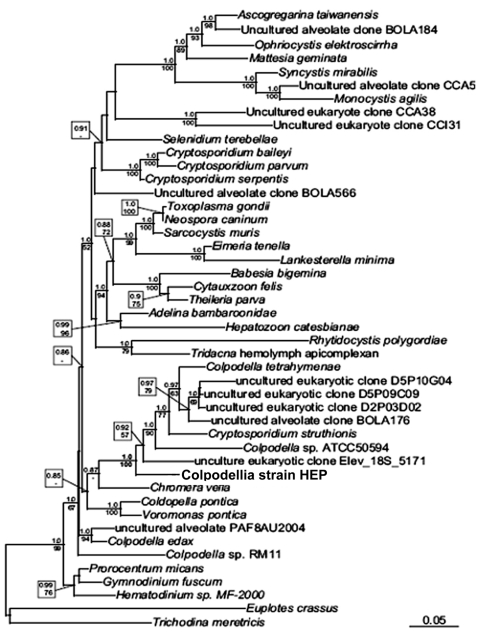
Figure 2.
Maximum-likelihood small subunit rDNA phylogenetic tree showing the position of a novel human erythrocytic parasite (in box). Numbers above nodes represent Bayesian posterior probabilities computed by using MrBayes 3.1.2 (www.phylogeny.fr/version2_cgi/one_task.cgi?task_type=mrbayes), with priors set to defaults and a Markov chain Monte Carlo run for 1,000,000 generations of which the first 100,000 were omitted from topology reconstruction. Numbers below nodes depict maximum-likelihood bootstrap support computed from 1,000 replications with the software and model described above. These numbers are bootstrap numbers and refer to the statistical confidence for that node as estimated by the different phylogenetic reconstruction methods. Scale bar indicates 1 base substitution/10 nt.

