Abstract
Objective
Computed tomography is the modality of choice for measuring osteolysis but suffers from metal-induced artefacts obscuring periprosthetic tissues. Previous papers on metal artefact reduction (MAR) show qualitative improvements, but their algorithms have not found acceptance for clinical applications. We investigated to what extent metal artefacts interfere with the segmentation of lesions adjacent to a metal femoral implant and whether metal artefact reduction improves the manual segmentation of such lesions.
Materials and methods
We manually created 27 periprosthetic lesions in 10 human cadaver femora. We filled the lesions with a fibrotic interface tissue substitute. Each femur was fitted with a polished tapered cobalt-chrome prosthesis and imaged twice—once with the metal, and once with a substitute resin prosthesis inserted. Metal-affected CTs were processed using standard back-projection as well as projection interpolation (PI) MAR. Two experienced users segmented all lesions and compared segmentation accuracy.
Results
We achieved accurate delineation of periprosthetic lesions in the metal-free images. The presence of a metal implant led us to underestimate lesion volume and introduced geometrical errors in segmentation boundaries. Although PI MAR reduced streak artefacts, it led to greater underestimation of lesion volume and greater geometrical errors than without its application.
Conclusion
CT metal artefacts impair image segmentation. PI MAR can improve subjective image appearance but causes loss of detail and lower image contrast adjacent to prostheses. Our experiments showed that PI MAR is counterproductive for manual segmentation of periprosthetic lesions and should be used with care.
Keywords: Computed tomography, Metal artifact reduction, Osteolysis, Segmentation, Beam hardening
Introduction
Aseptic loosening caused by osteolysis is one of the foremost problems limiting the survival of hip prostheses [1]. Plain radiographs (Fig. 1) are the default modality for evaluating osteolysis [2] but tend to underestimate lesion volume [1]. Claus et al. [3] even refers to “the lack of any relationship between the two-dimensional lesion size and the actual three-dimensional lesion volume.”
Fig. 1.
In a clinical radiograph, radiolucent lines adjacent to the prosthesis indicate osteolysis (arrows)
In recent years CT has gained popularity for quantifying periprosthetic osteolysis. There seems to be consensus that CT has superior sensitivity and measurement accuracy for the detection and measurement of osteolysis compared to traditional radiographs [4–8]. Unfortunately CT images suffer from metal-induced artefacts in the vicinity of metal prostheses [9, 10]. These most notably arise due to beam hardening and photon starvation [11, 12].
Although there still exists no general solution for removing metal-induced artefacts [13], several approaches have been offered. Glover and Pelc [14] and Kalender et al. [15] first proposed replacing metal sinogram projections with interpolations of adjacent data—referred to here as projection interpolation (PI) metal artefact reduction (MAR). To our knowledge all MAR techniques that have found clinical application are based on PI. A notable example is the algorithm [10] implemented on the Siemens SOMATOM from 1987 to 1990, and which is still undergoing further development [9]. Commercial software such as ScanIP (Simpleware, Exeter, U.K.) offers PI as an image preprocessing tool. These MAR techniques can lead to lowering of detail and cause unpredictable secondary artefacts, such as that described by Mahnken et al. as a “ground glass like fan-shaped artifact” [16].
In comparison, non-PI algorithms are computationally expensive and remain confined to academic papers [10, 17–20]. “Extended CT scale” techniques [21] have been made redundant by the 16-bit quantization used in modern scanners such as the Toshiba scanner used in this study.
The aim of this study was to examine the extent to which the presence of a metal hip prosthesis, and the subsequent application of PI MAR, affect the segmentation of periprosthetic fibrous lesions. Does the presence of metal decrease the manual segmentation performance of such lesions? Does MAR improve the manual segmentation compared to the metal-degraded CT images? To answer these questions we first compare the segmented lesion volumes to ground truthed volumes obtained by filling each lesion with water. Second, we compare the segmentation boundaries between scans acquired under optimal metal-free scanning to those found in metal-degraded images, both before and after the application of MAR. Contrast and image intensity gradients are measured across segmentation boundaries to help explain the results. This enables us to either recommend or warn against MAR as a preprocessing step in assessing periprosthetic lesions.
Materials and methods
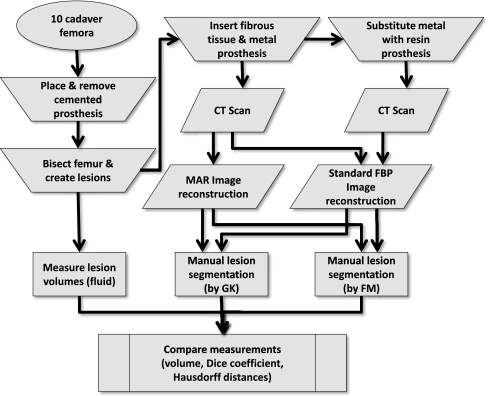
Figure 2 shows a flow chart of the complete experimental work flow. Ten human femora were retrieved post-mortem from seven donors. These comprised three female and seven male femora with a mean age of 80.7 years (range 67–98). Dual energy X-ray absorptiometry (DXA) measurements performed prior to preparation yielded a median T-score of −0.7 (average −1.4) within a range of −4.9 to +1.1. A T-score of −1 or higher is considered normal, whereas clinical osteoporosis is defined by a T-score of −2.5 or lower [22]. All femora were preserved in formalin and surrounding soft-tissue removed. We fitted each femur with a polished tapered cobalt-chrome Exeter size 42-2 stem (Stryker, Limerick, Ireland). For fixation we used radiopaque contrast-enhanced bone cement (Palacos, Biomet, Warsaw, IN, USA). The prostheses were implanted under supervision of an experienced orthopedic surgeon (H.J.L.vdH.) while using standard cemented implantation protocol.
Fig. 2.
Flow chart of the experiments performed in this study
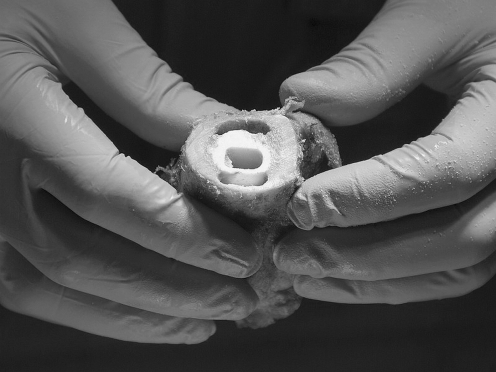
To enable scanning each femur with and without the metal prosthesis, we required removable prostheses. After each prosthesis was cemented it was mechanically removed from the femur, leaving the remaining cement mantle and femur intact (Figs. 3 and 4). This was possible due to the Exeter prosthesis’s smooth polished surface and tapered shape.
Fig. 3.
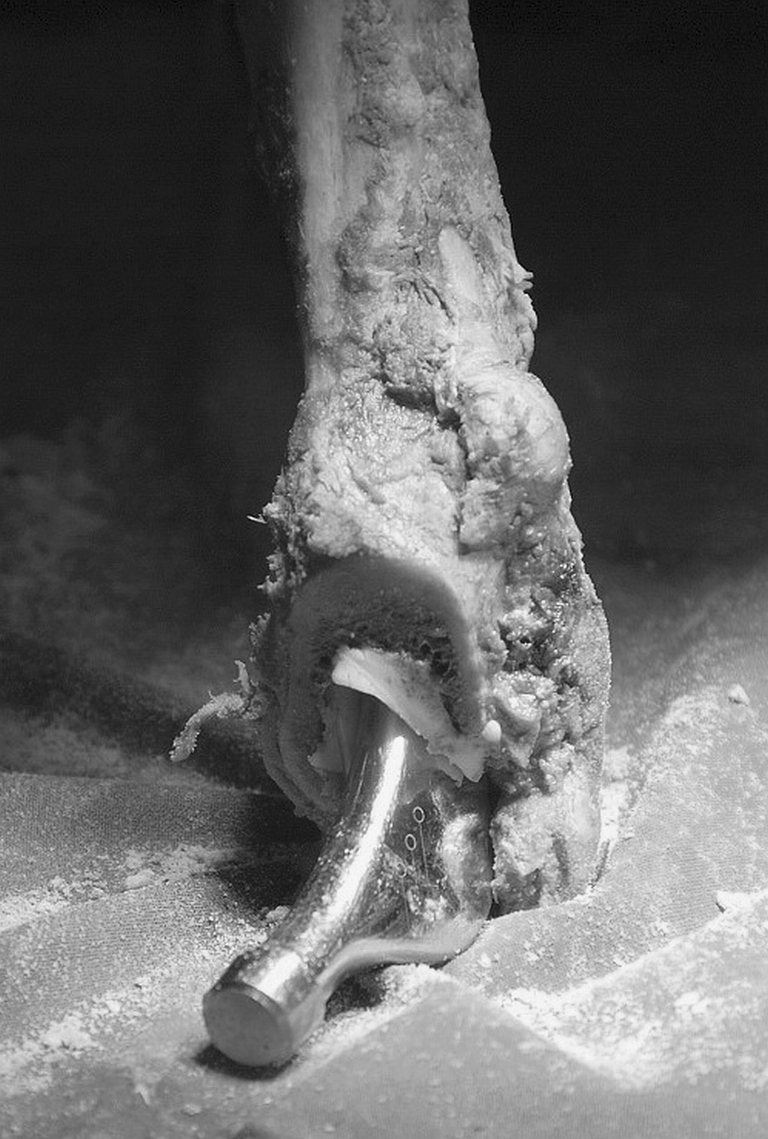
The removable Exeter prosthesis is shown partly dislodged from one of the test femora
Fig. 4.
Femoral lesions mechanically created anterior and posterior of the cement mantle are shown with the prosthesis removed
Each femur was axially bisected so as to intersect the cement mantle. We subsequently created lesions both proximally and distally from the sawn-through interface and at varying locations along the circumference (Fig. 4) using a rotary burr (Dremel). In total, 27 cavities were created having a mean volume of 2.4 ml (range 1.1–5.0 ml). We measured lesion volumes by using a 0.2 ml-graduated syringe to fill each cavity with water. The lesions were then drained and filled with a fibrous tissue substitute.
Previous studies used water [23], lean beef mince [8, 24], or an unspecified “soft-tissue equivalent” material to fill artificially created lesions [3]. In this study we specifically chose radiologically compatible tissue to represent the fibrotic zones. On four occasions, real periprosthetic fibrotic tissue was retrieved during hip implant revision surgery and its CT opacity measured ex vivo. These tissues had a mean opacity of 72 Hounsfield Units (HU) with standard deviation of 10 HU. This differs substantially from water (mean 0 HU) and our measurements for lean beef mince (mean 50 HU). After evaluating several commercially available alternatives we chose chicken liver, which was considered sufficiently similar with a mean opacity of 77 HU and standard deviation of 6 HU.
During scanning each femur required an inserted prosthesis to hold the two bisected halves in place. When the metal prosthesis was removed we used a mould-cast resin substitute. The resin had a measured CT opacity of 150 HU, placing it above the opacity of soft tissues and blood (∼50 HU), but less than bone (> 300 HU) and much less than metal (>3,000 HU) [25]. The resin prosthesis’s low radiopacity did not significantly contribute to beam hardening, the main source of metal-induced artefacts, and therefore enabled us to acquire optimal images for CT ground truthing.
Scans were performed on a helical CT scanner (Aquilion 16, Toshiba Medical Systems, Japan) at 135 kVp using a 200 mA tube current. The in-slice voxel spacing was 0.44 × 0.44 mm with a slice thickness of 0.5 mm. Following the advice of Lee et al. [12] and Douglas-Akinwande et al. [26], we chose a standard smooth reconstruction filter (FC 12) to minimize metal artefacts.
For MAR we used the recent sinogram-interpolation method of Veldkamp et al. [27]. This algorithm has a lot in common with the original method of Kalender et al. [15] but uses raw sinogram data to interpolate metal traces. Adding a fraction of the original metal signal to the interpolation has a similar role as the nonzero “confidence parameter” of Oehler et al. [28] and makes the implant visible in the final reconstruction.
Each of the 27 fibrotic lesions was independently and manually segmented by each of two experienced users (F.M. and G.K.) using MITK, an interactive segmentation software tool [29]. F.M. and G.K. independently segmented the resin prosthesis volumes as well as the metal prosthesis volumes with and without application of MAR. F.M. and G.K. segmented the volumes sequentially and in randomized order, with 2 weeks separating their segmentation work.
The volumes of the segmented lesions were compared to the physically measured ground-truthed fluid volumes. The metal-affected and MAR image segmentations were registered to their metal-free counterparts using a 3D iterative closest point (ICP) algorithm, correcting for translational and/or rotational offsets between scans. Geometric deviation in each segmented metal or MAR volume was compared to the corresponding metal-free resin prosthesis volume. To avoid interobserver bias when comparing segmentations performed with metal, MAR, or resin volumes, we always compared pairwise segmentations of the same lesion on a per-user basis. Measurements by F.M. and G.K. were treated as separate and not averaged.
The residual shape difference between each segmentation pair was computed by their Hausdorff distance, mean Hausdorff distance, and Dice coefficient. The Hausdorff distance is defined as the global maximum of all the minimum distances between two surfaces. The mean Hausdorff distance is the mean minimum distance between the two surfaces. The Dice coefficient is a ratio between the volumes enclosed by the two surfaces, defined by
For each segmentation boundary we computed the median image gradient magnitude, as well as the Michelson contrast between the inner and outer region defined by this boundary. The Michelson contrast for each lesion is defined as
Image registration, distance metrics, and contrast metrics were computed using the Insight Segmentation and Registration Toolkit (ITK), Visualization Toolkit (VTK) and the Python programming language. All computations were performed on the DeVIDE image processing and visualization platform [31].
We did not assume normal distributions of the measured differences in volume, edge gradient magnitude, Michelson contrast, pairwise Hausdorff distances, or Dice coefficients. This decision was supported by the Shapiro-Wilk test for normality, indicating that the hypothesis of normality should be rejected for several of the measurement pairs, as is also visually evidenced in asymmetry in several of the measurement distributions (e.g., see Figs. 6 and 8 below). Distributions of measurements and differences between measurement pairs are described by nonparametric measures such as median and interquartile range. Rather than the Student’s t-test we therefore chose the Wilcoxon signed rank test to compare measurements of the same quantities under metal-free, metal-containing, and MAR acquisition. We furthermore chose not to assume linear relationships between variables when testing for correlation, choosing instead to use Spearman’s rank correlation coefficient, which serves as a nonparametric analogue to Pearson’s correlation.
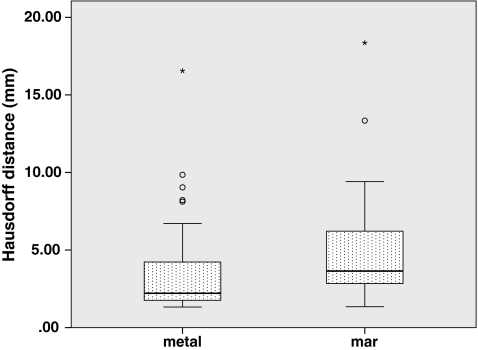
Fig. 6.
Hausdorff distances compared to “resin” ground-truthed results show maximum local segmentation boundary errors
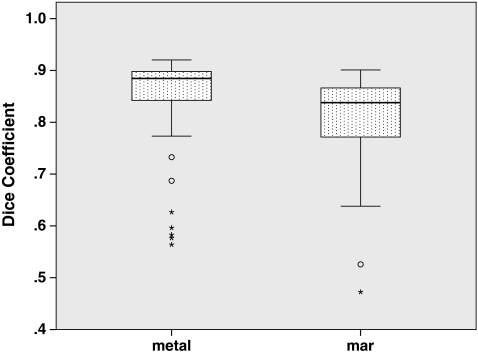
Fig. 8.
Dice coefficients compared to “resin” ground-truthed results show volumetric agreement between segmentations
Results
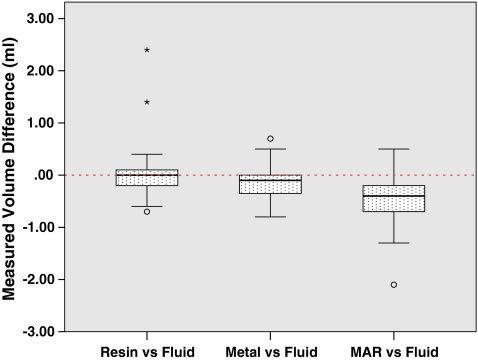
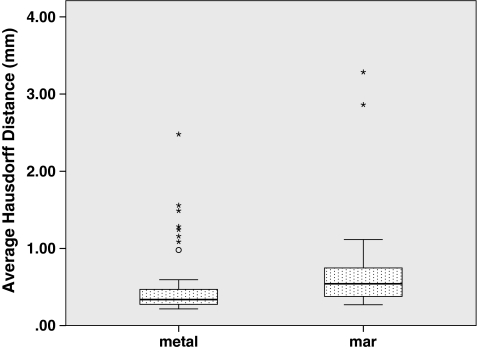
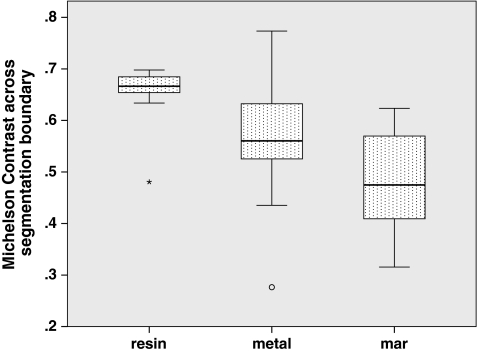
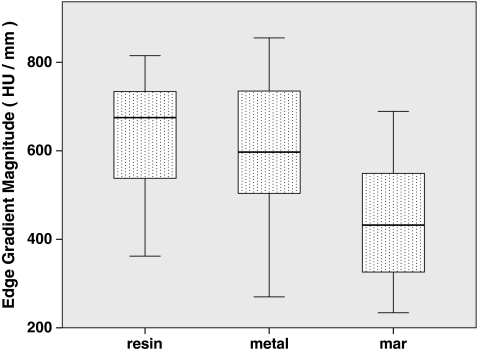
To answer whether the presence of metal degrades segmentation performance, we compared segmentations performed on the metal-free ground-truthed images to those of metal-affected images. In metal-free image segmentations we measured volumes that were not significantly different (P = 0.65) compared to the physically measured fluid volumes (Fig. 5), while metal-containing CT scans tended to significantly (P = 0.002) underestimate the physically measured volumes. The Hausdorff distances, mean Hausdorff distances, and Dice coefficients of metal-affected versus metal-free images show low dissimilarity albeit with several outliers (Figs. 6, 7, 8). Michelson contrast across segmentation boundaries is significantly lower (P = 0.002) than for metal-free scans ( Fig. 9). Image gradient magnitudes on segmentation boundaries also have a lower median value compared to metal-free images (Fig. 10), although this difference is not significant (P = 0.811).
Fig. 5.
Metal-free CT accurately estimates volume, whereas metal degradation causes volume underestimation. MAR causes even further volume underestimation
Fig. 7.
Mean Hausdorff distances compared to “resin” ground-truthed results show average segmentation boundary errors
Fig. 9.
The median Michelson contrast across each segmented lesion’s boundary
Fig. 10.
The median edge gradient magnitude across each segmented lesion’s boundary
The second question is whether PI MAR improves segmentation performance relative to unprocessed metal-degraded CT. Unexpectedly, we found that volumes measured after application of PI MAR were even smaller than those measured in the metal-affected scans (Fig. 5), and significantly smaller than the ground-truthed volumes (P < 0.001). We see that the MAR segmentations exhibit significantly larger geometrical deviations (P < 0.001 in all three cases) from the ground-truthed results than unprocessed metal scans (Figs. 6, 7, 8). Michelson contrast across segmentation boundaries (Fig. 9) is significantly lower than for either resin scans (P < 0.001) or unprocessed metal (P = 0.003). Image gradient magnitudes on segmentation boundaries (Fig. 10) are significantly reduced compared to either metal-free ground-truthed or unprocessed metal scans (P < 0.001 in both cases).
We found no significant correlation between the lesion size or DXA T-score and any of the measured parameters using Spearman’s rank correlation coefficient. Barring a statistically significant but small difference in segmentation volume we found observations between the two independent observers to agree well (Table 1).
Table 1.
Interobserver differences calculated pair wise over all lesions according to the Wilcoxon signed rank test. The only statistically significant difference is a 0.1 ml bias in measured volume
| Parameter | Median difference | 1st and 3rd quartiles | Significance |
|---|---|---|---|
| Volume | −0.1 ml | −0.3, 0.1 ml | 0.007 |
| Hausdorff distance | −0.62 mm | −3.04, 1.86 mm | 0.400 |
| Mean Hausdorff distance | −0.009 mm | −0.128, 0.137 mm | 0.474 |
| Dice coefficient | −0.0028 | −0.0531, 0.0448 | 0.453 |
| Median Michelson edge contrast | 0.0046 | −0.0212, 0.0123 | 0.885 |
| Median edge gradient magnitude | −9 HU/mm | −29, 3 HU/mm | 0.228 |
HU Hounsfield units
Discussion
We set out to determine whether the presence of a metal prosthesis and subsequent projection interpolation metal artefact reduction (PI MAR) affect the segmentation of periprosthetic lesions resembling osteolysis. We compared segmentation volume as well as geometrical deviation between segmentations performed with and without the presence of metal and after application of PI MAR.
We believe that the observed trend of lowered segmentation performance due to MAR is widely relevant to the diagnosis and quantification of periprosthetic tissues from CT. Our experimental data were obtained under optimal scanning conditions, with all soft-tissue removed from around the femora. In the clinical setting the image degrading effects of metal-induced beam hardening, as well as secondary artefacts created by MAR, are likely to present a greater obstacle to lesion detection and quantification than in the carefully controlled environment described in this paper. Through inspection we believe that the threshold we used for identifying metal prosthesis yielded a good segmentation of the metal boundary while still excluding all surrounding biological tissue. Using a different threshold affects the delineation of the interpolation region, and subsequently also the amount and the location of detail lost to the MAR algorithm. A detail-retaining compromise could involve decreasing the interpolation regions’ size at the cost of artefact suppression.
We found no tendency for manual CT-based segmentation to either over- or underestimate lesion volume in the absence of metal hardware. When a metal prosthesis was introduced, however, lesion volume was underestimated. This agrees with Walde et al. [8] and Leung et al. [32] who found that CT neither consistently underestimated nor overestimated lesion volume, and Stamenkov et al. [23] who found that CT systematically underestimates lesion volume in the presence of metal artefacts. We explain this tendency by our measurements, which show that metal-induced artefacts cause lower contrast across lesion boundaries, which negatively influences their visibility.
Contrary to expectation we found that lesion segmentation deteriorated even further after application of PI MAR, with larger associated underestimation of lesion volume and larger geometrical errors. PI MAR reduced image noise in homogenous regions, but this was achieved at the cost of a substantial loss of detail, evidenced by lowered edge gradients and image contrast across lesion boundaries. Kalender et al. [15] mentioned that PI MAR works best for objects with simple near-circular geometries, while Watzke and Kalender [10] mentioned that PI MAR is well suited to larger implants consisting of dense metal. This view is also echoed by Liu et al. [9] who wrote that MAR improved image quality in scans of large prostheses, whereas it had a negative effect on small metal objects due to image blurring. In this regard we expected PI MAR to be of benefit since the Exeter prosthesis chosen for this study meets the requirements mentioned above. Except for its smoother appearance (Fig. 11c), there is little to recommend the application of PI MAR above the original metal degraded image (Fig. 11b). Detail in the MAR image is noticeably blurred—especially in regions closest to the metal prosthesis. This is supported by a measured lowering of edge contrast and edge gradient magnitude after application of PI MAR (Figs. 9 and 10).
Fig. 11.
Each of the three image modalities for an image slice that bisects two fibrous-tissue lesions (arrows). A display window of −1,000 to 3,000 HU was used in all three cases. a The image quality is good with resin prosthesis in place. b With the metal prosthesis, beam-hardening artefacts manifest as shadows and blooming of the metal region. c After in-painting of the metal sinogram the artefacts are reduced but at the cost of a loss in periprosthetic detail
Papers showcasing MAR algorithms [16, 17, 19] emphasize “starburst” artefacts by choosing display windows that create the impression that these artefacts completely obliterate all image detail in their path. This study suggests that a human operator who has to manually delineate structures adjacent to a metal prosthesis might obtain better segmentations from unfiltered artefact-containing images than from images processed with PI MAR. This contrasts with the view that MAR invariably improves the appearance and usefulness of metal-affected clinical scans. However, in patients with bilateral prostheses, as often seen in practice, the beam hardening shadow connecting the two prostheses is much more pronounced than in this single prosthesis experiment. In this scenario PI MAR can improve the subjective appearance of radiographic cross sections by equalizing the shadow regions [10, 19]. This improvement is often confirmed by radiologists’ subjective rating [9]. For our application of measuring periprosthetic lesions, however, there seems to be a net loss of quantifiable image information when applying PI MAR.
CT, in the absence of metal artefacts, is an accurate and unbiased tool for measuring the volume and geometry of periprosthetic lesions. When adding the presence of a metal prosthesis the result remains usable, albeit with degraded image quality, increased difficulty in discerning structures, and a tendency to underestimate lesion volume. Previous studies [9, 17] investigating the merits of MAR used subjective rating scales to assess image quality and limited quantitative measurements to mean CT number and standard deviation within certain regions of interest. A strength of our study is its quantitative evaluation of segmentation performance, albeit for a small set of lesions.
A limitation of this study is the inclusion of only 27 fibrotic lesions from 10 human cadaver femora, all using the same type of metal prosthesis and scanned in the same CT scanner. We limited ourselves to evaluating a single software PI MAR implementation, and independent segmentations were performed by only two operators. Although the femora were harvested from older patients, only two of the 10 samples had DXA T-scores suggesting osteoporosis, whereas osteoporosis may be more common in patient populations. Our manually created lesions lacked the radio-dense sclerotic borders that may be found in clinical practice [33, 34]. The current clinical significance of MAR algorithms is low, although it remains an active field of research. We suggest that in addition to our general observations, validation should be performed in any specific clinical setting whenever PI MAR is to be considered.
Conclusion
Despite its popularity in the literature and superficial improvements to image appearance, projection interpolation metal artefact reduction (PI MAR) was detrimental to the user-guided segmentation described in this paper. It remains to be seen whether other image-based metal artefact reduction techniques can improve quantitative segmentation results of such periprosthetic lesions.
Acknowledgments
The authors would like to thank Fred van Immerseel at the LUMC Department of Anatomy for the use of their facilities and equipment, and for their cooperation in the preparation of the specimens. Furthermore we thank Koos Geleijns and Paul de Bruin at the LUMC Department of Clinical Physics, who assisted with the CT scans, and for their useful comments. Thanks goes out to Tim J. van der Steenhoven who provided DXA bone density measurements for the femora. This research is supported by the Dutch Technology Foundation STW, which is the applied science division of NWO, and the Technology Programme of the Ministry of Economic Affairs (project number LKG 7943).
Open Access
This article is distributed under the terms of the Creative Commons Attribution Noncommercial License which permits any noncommercial use, distribution, and reproduction in any medium, provided the original author(s) and source are credited.
Footnotes
This study was funded by the Netherlands Organization for Scientific Research (NWO) and the Stichting STW.
All work was performed at Leiden University Medical Center, Leiden, The Netherlands.
Contributor Information
Daniel F. Malan, Phone: +31-71-5262852, FAX: +31-71-5266743, Email: fmalan@medvis.org
Charl P. Botha, Email: c.p.botha@tudelft.nl
Gert Kraaij, Email: g.kraaij@lumc.nl.
Raoul M. S. Joemai, Email: R.M.S.Joemai@lumc.nl
Huub J. L. van der Heide, Email: H.J.L.van_der_Heide@lumc.nl
Rob G. H. H. Nelissen, Email: R.G.H.H.Nelissen@lumc.nl
Edward R. Valstar, Email: e.r.valstar@lumc.nl
Reference
- 1.Agarwal S. Osteolysis—basic science, incidence and diagnosis. Curr Orthop. 2004;18:220–231. doi: 10.1016/j.cuor.2004.03.002. [DOI] [Google Scholar]
- 2.Garcia-Cimbrelo E, Tapia M, Martin-Hervas C. Multislice computed tomography for evaluating acetabular defects in revision THA. Clin Orthop 2007;463:138–43. [PubMed]
- 3.Claus AM, Engh CA, Sychterz CJ, Xenos JS, Orishimo KF, Engh CA. Radiographic definition of pelvic osteolysis following total hip arthroplasty. J Bone Joint Surg Am. 2003;85-A:1519–1526. doi: 10.2106/00004623-200308000-00013. [DOI] [PubMed] [Google Scholar]
- 4.Cahir JG, Toms AP, Marshall TJ, Wimhurst J, Nolan J. CT and MRI of hip arthroplasty. Clin Radiol. 2007;62:1163–1171. doi: 10.1016/j.crad.2007.04.018. [DOI] [PubMed] [Google Scholar]
- 5.Looney RJ, Boyd A, Totterman S, Seo G-S, Tamez-Pena J, Campbell D, et al. Volumetric computerized tomography as a measurement of periprosthetic acetabular osteolysis and its correlation with wear. Arthritis Res. 2002;4:59–63. doi: 10.1186/ar384. [DOI] [PMC free article] [PubMed] [Google Scholar]
- 6.Puri L, Wixson RL, Stern SH, Kohli J, Hendrix RW, Stulberg SD. Use of helical computed tomography for the assessment of acetabular osteolysis after total hip arthroplasty. J Bone Joint Surg Am. 2002;84-A:609–614. doi: 10.2106/00004623-200204000-00016. [DOI] [PubMed] [Google Scholar]
- 7.Schwarz EM, O'Keefe RJ, Campbell D, Totterman S, Boyd A, Looney RJ. Use of volumetric computerized tomography as a primary outcome measure to evaluate drug efficacy in the prevention of peri-prosthetic osteolysis: a 1-year clinical pilot of etanercept vs. placebo. J Orthop Res. 2003;21:1049–1055. doi: 10.1016/S0736-0266(03)00093-7. [DOI] [PubMed] [Google Scholar]
- 8.Walde Ta, Weiland DE, Leung SB, Kitamura N, Sychterz CJ, Engh CA, et al. Comparison of CT, MRI, and radiographs in assessing pelvic osteolysis. Clin Orthop 2005;138–44. [DOI] [PubMed]
- 9.Liu PT, Pavlicek WP, Peter MB, Spangehl MJ, Roberts CC, Paden RG. Metal artifact reduction image reconstruction algorithm for CT of implanted metal orthopedic devices: a work in progress. Skeletal Radiol. 2009;38:797–802. doi: 10.1007/s00256-008-0630-5. [DOI] [PubMed] [Google Scholar]
- 10.Watzke O, Kalender WA. A pragmatic approach to metal artifact reduction in CT: merging of metal artifact reduced images. Eur J Radiol. 2004;14:849–856. doi: 10.1007/s00330-004-2263-y. [DOI] [PubMed] [Google Scholar]
- 11.Kalender WA. Computed tomography—fundamentals, system technology, image quality, applications, 2nd ed. Erlangen: Publicis; 2005.
- 12.Lee M-J, Kim S, Lee S-A, Song H-T, Huh Y-M, Kim D-H, et al. Overcoming artifacts from metallic orthopedic implants at high-field-strength MR imaging and multi-detector CT. Radiographics. 2007;27:791–803. doi: 10.1148/rg.273065087. [DOI] [PubMed] [Google Scholar]
- 13.Hsieh J. Computed tomography: principles, design, artifacts, and recent advances. Bellingham, WA: SPIE; 2003.
- 14.Glover GH, Pelc NJ. An algorithm for the reduction of metal clip artifacts in CT reconstructions. Med Phys. 1981;8:799–807. doi: 10.1118/1.595032. [DOI] [PubMed] [Google Scholar]
- 15.Kalender WA, Hebel R, Ebersberger J. Reduction of CT artifacts caused by metallic implants. Radiology 1987;576–7. [DOI] [PubMed]
- 16.Mahnken AH, Raupach R, Wildberger JE, Jung B, Heussen N, Flohr TG, et al. A new algorithm for metal artifact reduction in computed tomography: in vitro and in vivo evaluation after total hip replacement. Invest Radiol. 2003;38:769–775. doi: 10.1097/01.rli.0000086495.96457.54. [DOI] [PubMed] [Google Scholar]
- 17.Bal M, Spies L. Metal artifact reduction in CT using tissue-class modeling and adaptive prefiltering. Med Phys. 2006;33:2852–2859. doi: 10.1118/1.2218062. [DOI] [PubMed] [Google Scholar]
- 18.De Man B, Nuyts J, Dupont P, Marchal G, Suetens P. An iterative maximum-likelihood polychromatic algorithm for CT. IEEE Trans Med Imaging. 2001;20:999–1008. doi: 10.1109/42.959297. [DOI] [PubMed] [Google Scholar]
- 19.Lemmens C, Faul D, Nuyts J. Suppression of metal artifacts in CT using a reconstruction procedure that combines MAP and projection completion. IEEE Trans Med Imaging. 2009;28:250–260. doi: 10.1109/TMI.2008.929103. [DOI] [PubMed] [Google Scholar]
- 20.Wang G, Frei T, Vannier MW. Fast iterative algorithm for metal artifact reduction in X-ray CT. Acad Radiol. 2000;7:607–614. doi: 10.1016/S1076-6332(00)80576-0. [DOI] [PubMed] [Google Scholar]
- 21.Link TM, Berning W, Scherf S, Joosten U, Joist A, Engelke K, et al. CT of metal implants: reduction of artifacts using an extended CT scale technique. J Comput Assist Tomogr. 2000;24:165–172. doi: 10.1097/00004728-200001000-00029. [DOI] [PubMed] [Google Scholar]
- 22.Beers MH. The Merck manual of diagnosis and therapy, 18 ed. West Point, PA: Merck; 2006.
- 23.Stamenkov R, Howie D, Taylor J, Findlay D, McGee M, Kourlis G, et al. Measurement of bone defects adjacent to acetabular components of hip replacement. Clin Orthop 2003;117–24. [DOI] [PubMed]
- 24.Weiland DE. Walde Ta, Leung SB, Sychterz CJ, Ho S, Engh CA, et al. Magnetic resonance imaging in the evaluation of periprosthetic acetabular osteolysis: a cadaveric study. J Orthop Res. 2005;23:713–719. doi: 10.1016/j.orthres.2005.02.007. [DOI] [PubMed] [Google Scholar]
- 25.Mukherjee D, Rajagopalan S. CT and MR angiography of the peripheral circulation: practical approach with clinical protocols. Andover, Hampshire, UK: Thomson Publishing Services; 2007. [Google Scholar]
- 26.Douglas-Akinwande AC, Buckwalter KA, Rydberg J, Rankin JL, Choplin RH. Multichannel CT: evaluating the spine in postoperative patients with orthopedic hardware. Radiographics. 2006;26(Suppl 1):S97–S110. doi: 10.1148/rg.26si065512. [DOI] [PubMed] [Google Scholar]
- 27.Veldkamp WJH, Joemai RMS, van der Molen AJ, Geleijns J. Development and validation of segmentation and interpolation techniques in sinograms for metal artifact suppression in CT. Med Phys. 2010;37(2):620–628. doi: 10.1118/1.3276777. [DOI] [PubMed] [Google Scholar]
- 28.Oehler M, Kratz B, Knopp T, Müller J, Buzug TM. Evaluation of surrogate data quality in sinogram-based CT metal-artifact reduction. In: SPIE symposium on optical engineering—image reconstruction from incomplete data conference, August 2008, San Diego, p. 1–10.
- 29.Maleike D, Nolden M, Meinzer H-P, Wolf I. Interactive segmentation framework of the Medical Imaging Interaction Toolkit. Comput Methods Programs Biomed. 2009;96:72–83. doi: 10.1016/j.cmpb.2009.04.004. [DOI] [PubMed] [Google Scholar]
- 30.van der Lijn F, den Heijer T, Breteler MMB, Niessen WJ. Hippocampus segmentation in MR images using atlas registration, voxel classification, and graph cuts. NeuroImage. 2008;43(4):708–720. doi: 10.1016/j.neuroimage.2008.07.058. [DOI] [PubMed] [Google Scholar]
- 31.Botha CP, Post FH. Hybrid scheduling in the DeVIDE eataflow visualisation environment. Proc Simul Visualization. 2008;1:309–322. [Google Scholar]
- 32.Leung S, Naudie D, Kitamura N, Walde T, Engh CA. Computed tomography in the assessment of periacetabular osteolysis. J Bone Joint Surg Am. 2005;87:592–597. doi: 10.2106/JBJS.D.02116. [DOI] [PubMed] [Google Scholar]
- 33.Bauer TW, Schils J. The pathology of total joint arthroplasty. Skeletal Radiol. 1999;28:483–497. doi: 10.1007/s002560050552. [DOI] [PubMed] [Google Scholar]
- 34.Sofka CM. Current applications of advanced cross-sectional imaging techniques in evaluating the painful arthroplasty. Skeletal Radiol. 2007;36:183–193. doi: 10.1007/s00256-006-0226-x. [DOI] [PubMed] [Google Scholar]


