
Figure 4.
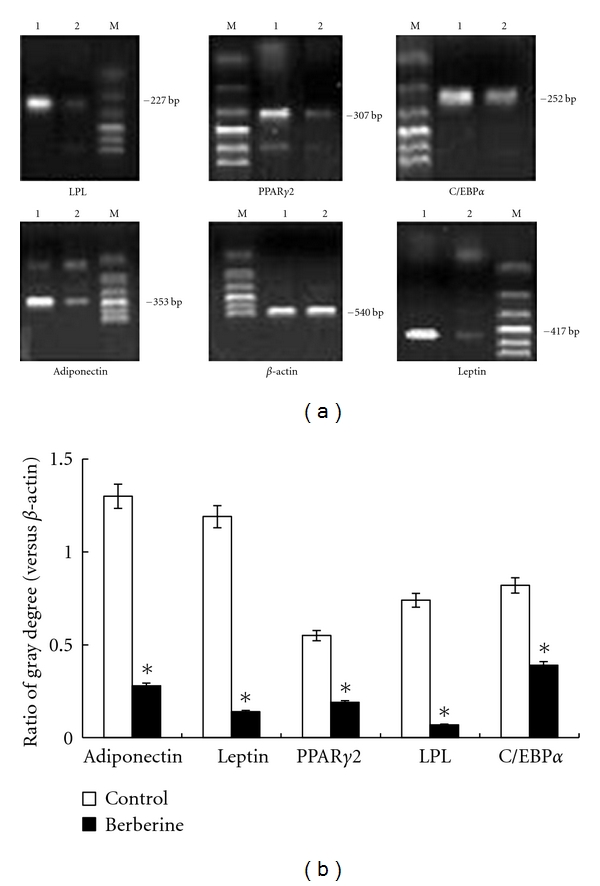
Effect of berberine on PPARγ2, lipoprotein lipase, C/EBPα, leptin, and adiponectin mRNA expression in differentiated preadipocytes analyzed using RT-PCR. (a) Digital photos of PCR products in agarose gel. Lane 1: control group, lane 2: 10 μM berberine, lane M: DNA markers. (b) Results are expressed as the ratio between the intensity of band corresponding to target gene versus that to β-actin, representing the mean ± SEM of the three separate experiments in triplicate. *P < 0.05, compared to control.