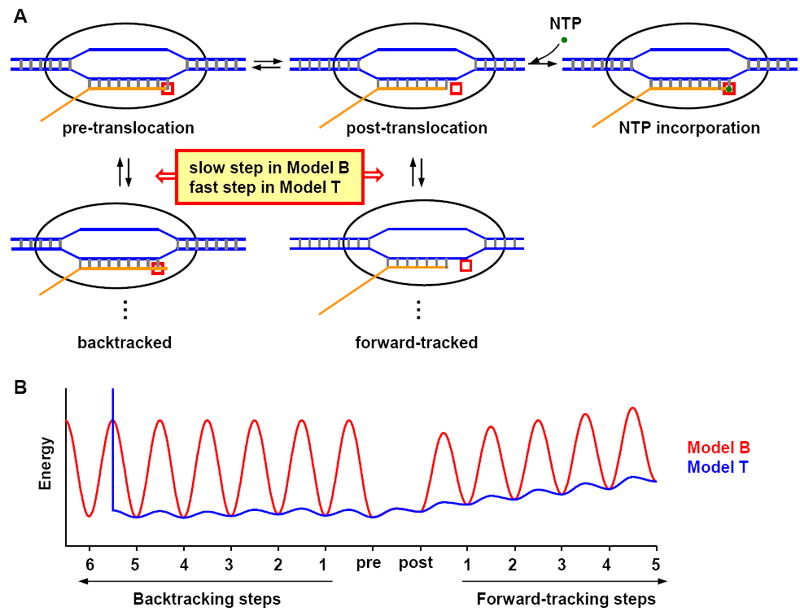
Figure 1. Overview of the two models.

A) Cartoon of the transcription elongation pathway. During elongation, the RNA polymerase unwinds a stretch of dsDNA (blue), with one strand forming a double helix with the nascent RNA (orange). The transcription elongation complex (TEC) has different translocation states, which are defined by the relative locations between the RNA 3’ end and the RNAP active site (red box): in the pre-translocation state, the RNA 3’ end is inside the active site; in the post-translocation state, active site is empty and RNA 3’ end is in its immediate vicinity. Only in this position, TEC is able to bind and incorporate the incoming NTP (green dot); in the backtracked state, RNA 3’ end passes the active site into the secondary channel; in the forward-tracked state, RNA active site moved further downstream from the RNA 3’ end, resulting in a shortened DNA-RNA hybrid. The pathways used in the two models are almost identical, and as indicated in the plot, the main difference lies in the kinetic rates in the branch pathways (see text for detail). B) Typical translocation energy landscape in Model B (red) and Model T (blue). The troughs of the curves represent the TEC free energy in different translocation states, and the peaks in between neighboring troughs are the activation barriers that affect the translocation rate. In general, the energy barriers for backtracking and forward-tracking in Model B are much higher than those in Model T.
