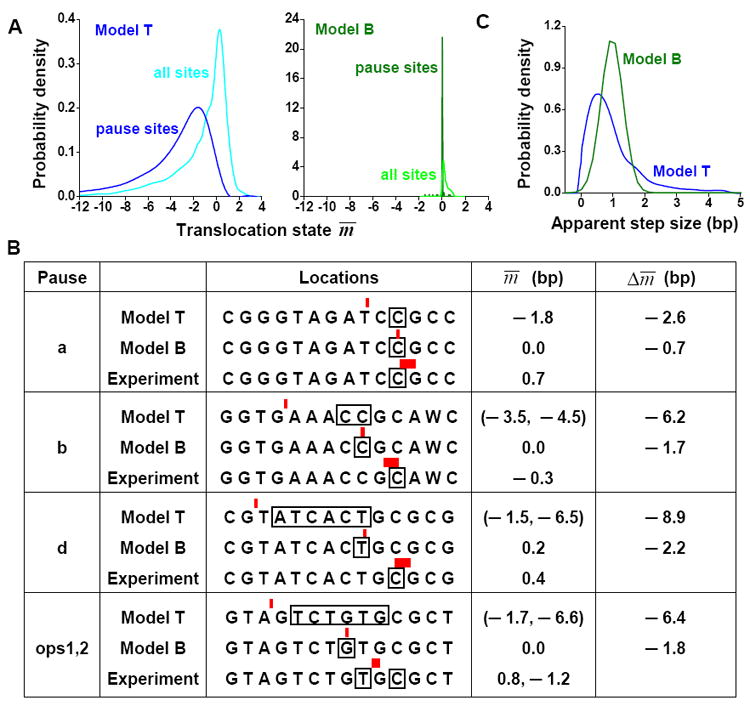
Figure 4. Comparison of the prediction of pause mechanism.

A) The predicted histogram of the mean translocation state m̅∣n by Model T (left) and Model B (2007) (right) for all positions, or for pause sites alone, on the ten templates used in Tadigotla et al. (2006). B) Comparison of the predicted and measured (8) translocation states of the pause sites from the his and ops templates. For the experimental data, each red bar indicates pause position measured by single molecule techniques and the width of the bar indicates the uncertainty in the measurement; each black box indicates the location of the 3’end of the RNA during pausing as determined by a transcription gel. The distance between the bar and the box thus indicates the RNAP translocation state at the pause site. Similar notation is used for predictions by the two models. Model B predicted a single pause site with a single RNAP position on the DNA template for each sequence. On the other hand, Model T predicted multiple pause sites for some sequences but a single location of RNAP on the DNA template during pausing. The two columns on the right show the distance of the RNAP on the DNA template from the pre-translocation state, and the difference in the predicted and measured position of RNAP. C) RNAP apparent step size distributions predicted by Model T and Model B under 18 pN assisting force.
