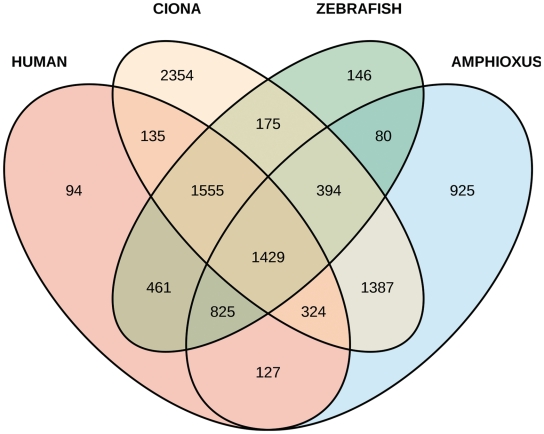
Figure 2:
Venn diagram of gene loss in different chordates. Each of the four species lost the total number of genes indicated in the last column of Table II. The intersections show the number of genes lost in common between any two, three or four species.

