Figure 3.

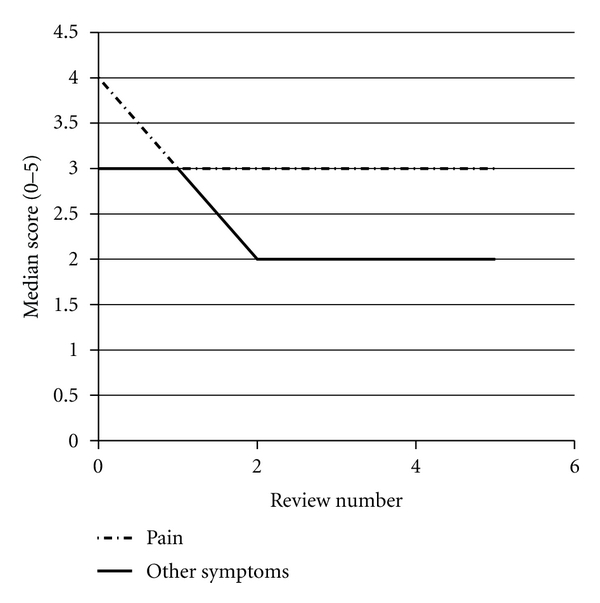
Changes in median APCA POS scores for pain and symptom control over time using the APCA POS. This graph depicts the changes in median scores for questions 1 and 2 from baseline to review number 5.

Changes in median APCA POS scores for pain and symptom control over time using the APCA POS. This graph depicts the changes in median scores for questions 1 and 2 from baseline to review number 5.