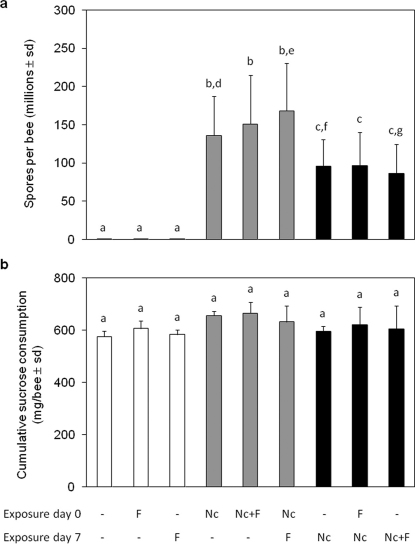
Figure 3. N. ceranae development success and honeybee cumulative sucrose consumption on day 22.
Mean number of (a) spores per honeybee abdomen (in millions ± standard deviation, sd, n = 585) and (b) total sucrose consumption (mg/bee ± sd from 3 replicates of 50 initial individuals) in surviving honeybees on day 22, in response to various N. ceranae (Nc) and fipronil (F) treatments. White bars represent data of non-experimentally infected honeybees, grey bars that of honeybees infected by N. ceranae at the emergence and black bars that of honeybees infected by N. ceranae at the age of 7 days. Significant differences (p≤0.05) using Kolmogorov-Smirnov test between each experimental group are indicated by non-corresponding letters.

