
Figure 9.
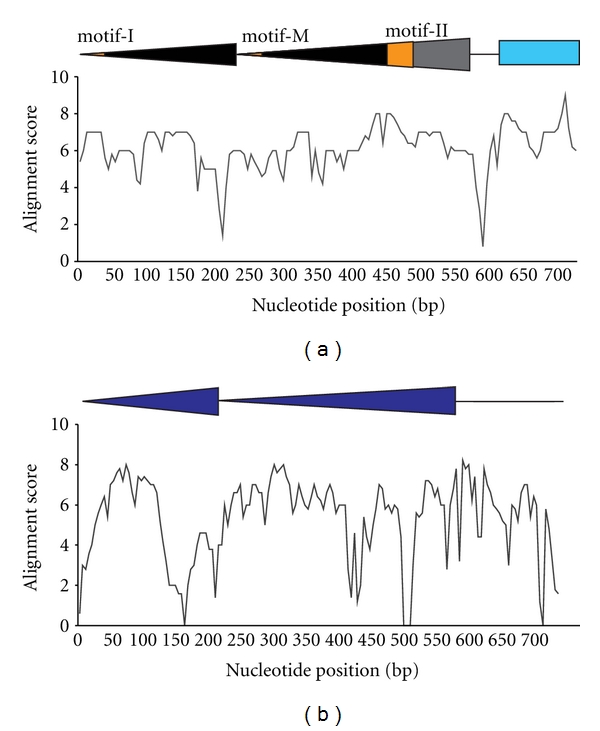
Nucleotide conservation across the two tandem TIRs. (a) Tandem TIRs from PM-ZIBP. (b) Tandem TIRs from type 2-46. The nucleotide conservation scores are calculated as an average of 5 nucleotide position scores from the copies of the element. Colored or black triangles represent the TIR. In Figure 9(a), the orange regions indicate the 3 repetitive motifs (see text). Colored box indicates part of the acquired gene fragment.