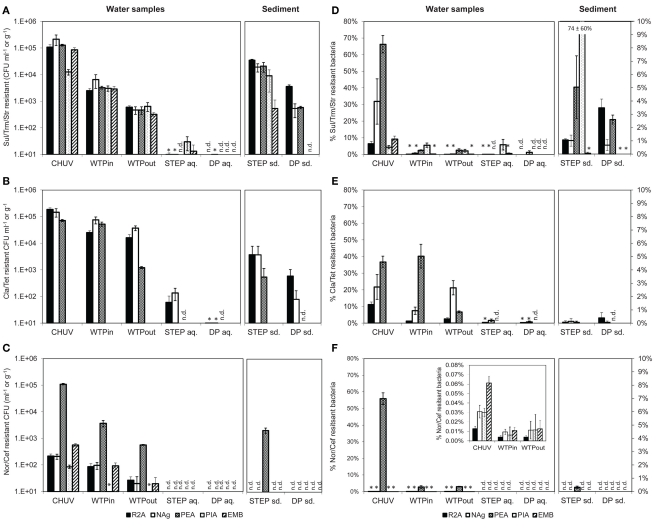
Figure 4.
(A–C) Total viable counts, normalized to sample volume or mass, in the presence of (A) Sul/Trm/Str, (B) Cla/Tet, and (C) Nor/Cef. (D–F) Abundance, relative to total viable counts without antibiotics, in the presence of (D) Sul/Trm/Str, (E) Cla/Tet, and (F) Nor/Cef. The insert in (F) shows abundance of selected samples at an adjusted scale. An asterisk (*) indicates less than 10 CFU ml−1 in (A–C) and less than 1% relative abundance in (D–F). n.d., no colonies detected. Error bars indicate standard deviation of triplicate platings of the same sample.

