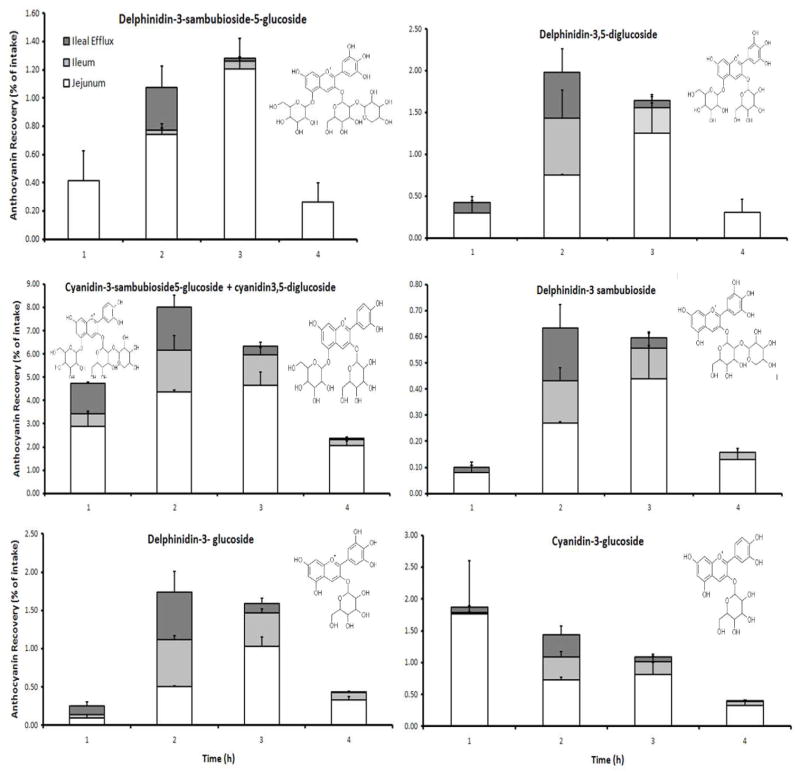
Figure 3.
Bioaccessibility of six abundant maqui berry anthocyanins expressed as percentage of intake using TIM. Recoveries were calculated as a percentage of the ingested amount of anthocyanin that was administered to TIM. The availability for intestinal absorption (bioaccessibility) of each anthocyanin was separately measured in 1 h time periods for 4 h. The amount of jejunal absorption (white bars), ileal absorption (light gray bars) and ileal efflux (dark grey bars) are shown separately for each time period as determined by HPLC/MS and presented as stacked bar graphs, which represent the total bioaccessibility of each anthocyanin for each time period. The chemical structure of each anthocyanin is shown. The results are the mean of two independent bioaccessibility experiments +/− the dispersion range.

