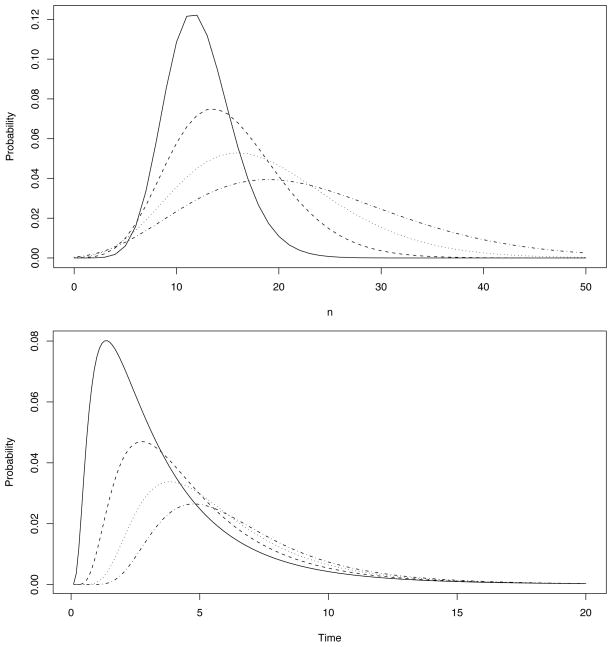
Fig. 2.
Transition probabilities for the immigration/emigration model with λ = 0.5, ν = 0.2, μ = 0.3, and γ= 0.1. The top panel shows P10,n(t) with t = 1 (solid line), t = 2 (dashed line), t = 3 (dotted line), and t = 4 (dash-dotted line) for n = 0,…, 50. The bottom panel shows P10,n(t) with n = 15 (solid line), n = 20 (dashed line), n = 25 (dotted line), and n = 30 (dash-dotted line) for t ∈ (0, 20).

