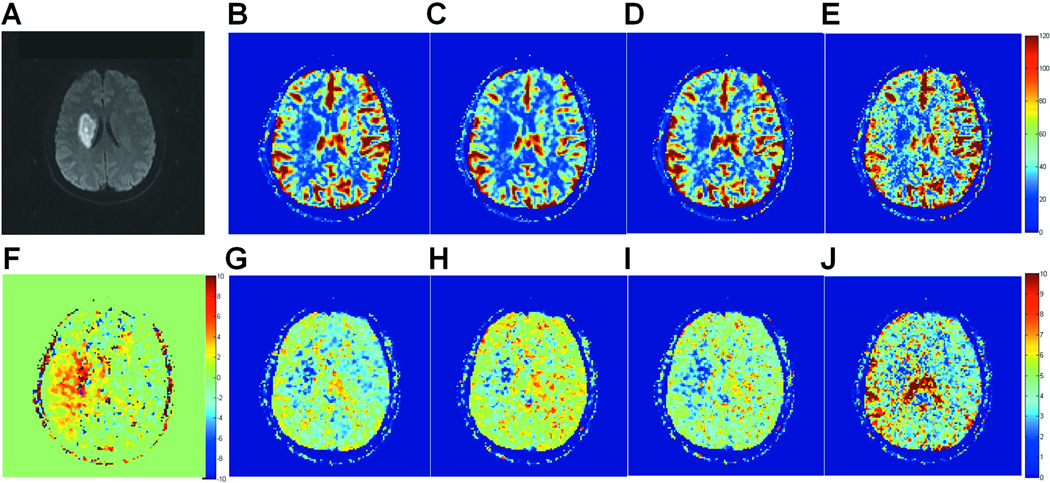
Figure 7.
A is a diffusion-weighted image of a representative brain slice showing a well-defined infarct area. B, C, D, and E are qCBF maps (in ml/100 g/min) of the same slice obtained with standard SVD, rSVD, cSVD, and bSVD, respectively. F is a ΔBAT map (in s), and G, H, I, and J are MTT maps (in s) of the same slice obtained with standard SVD, rSVD, cSVD, and bSVD, respectively.

