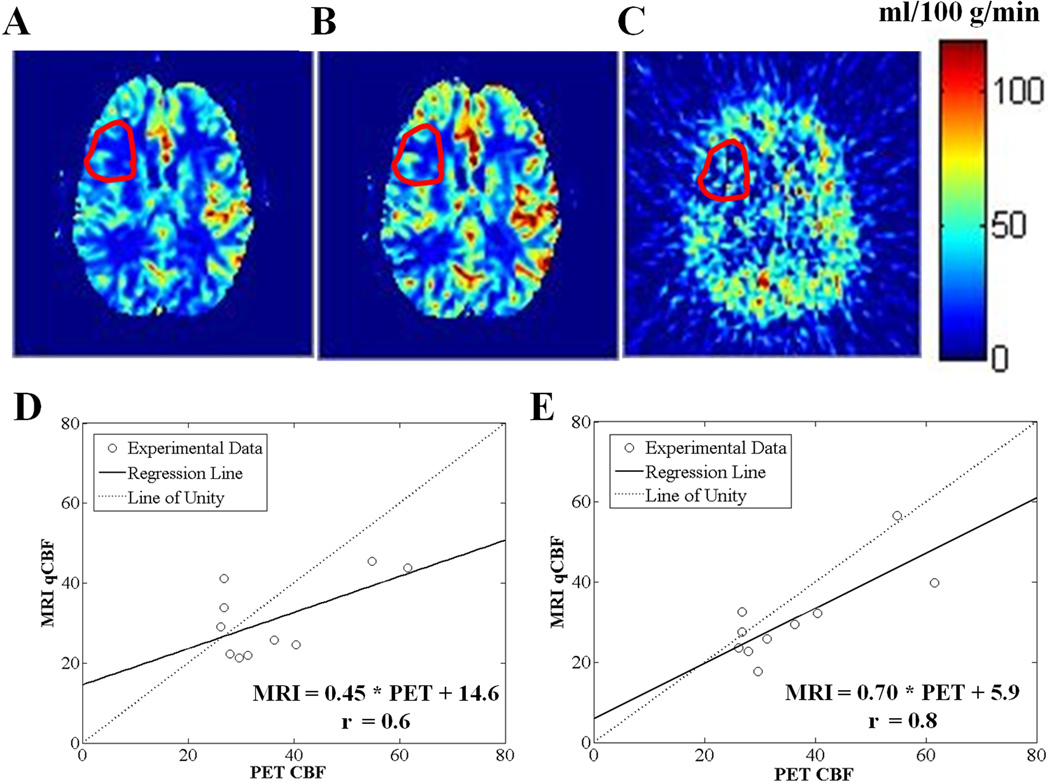
Figure 8.
A and B are MR qCBF maps before (SVD) and after (bSVD) applying the delay-dispersion correction, respectively, and C is the corresponding PET CBF map, for a representative patient with cerebrovascular occlusive disease. Mean CBF values in the ROIs with delayed arrival (shown in red) are: 21.9 ± 9.2, 25.8 ± 13.8, and 30.7 ± 17.8 ml/100 g/min, for A, B, and C, respectively. D and E are MR-PET correlation plots for the patients’ ROIs at 3.0T, before (SVD) and after (bSVD) applying the delay-dispersion correction, respectively: the regression line (solid line) and the line of unity (dotted line) are shown.

