
Fig. 4.
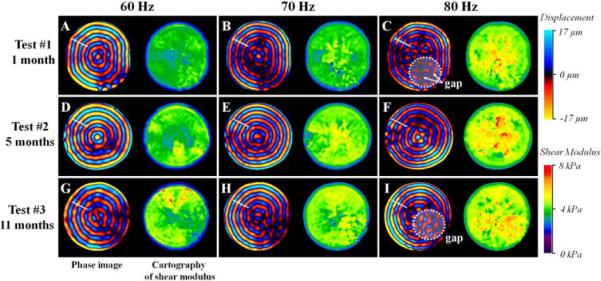
Representation of the phase images and the corresponding cartography of shear modulus obtained through MRE tests performed at 1 (test #1), 5 (test #2) and 11 (test #3) months at three different frequencies 60 Hz, 70 Hz and 80 Hz.
Official websites use .gov
A
.gov website belongs to an official
government organization in the United States.
Secure .gov websites use HTTPS
A lock (
) or https:// means you've safely
connected to the .gov website. Share sensitive
information only on official, secure websites.
Representation of the phase images and the corresponding cartography of shear modulus obtained through MRE tests performed at 1 (test #1), 5 (test #2) and 11 (test #3) months at three different frequencies 60 Hz, 70 Hz and 80 Hz.