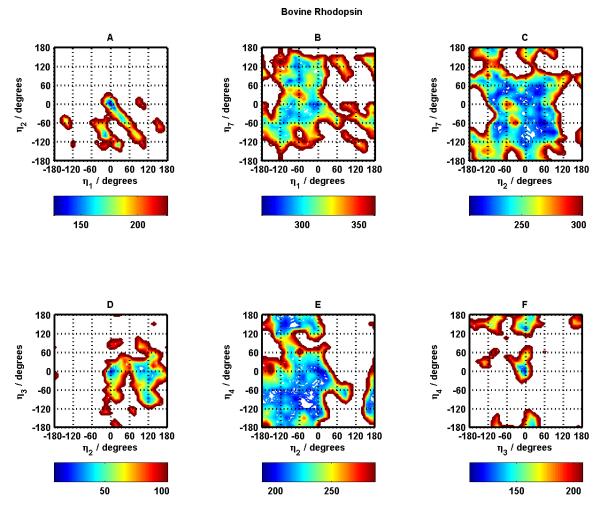
Figure 4.
Bovine Rhodopsin potential energy surfaces for helix pairs TM1-TM2 (A), TM1-TM7 (B), TM2-TM7 (C), TM2-TM3 (D), TM2-TM4 (E), and TM3-TM4 (F) as a function of helix rotation angles for corresponding helices. The energies are in kcal/mol, where the colorbar under each panel shows the lowest 100 kcal/mol energy range.

