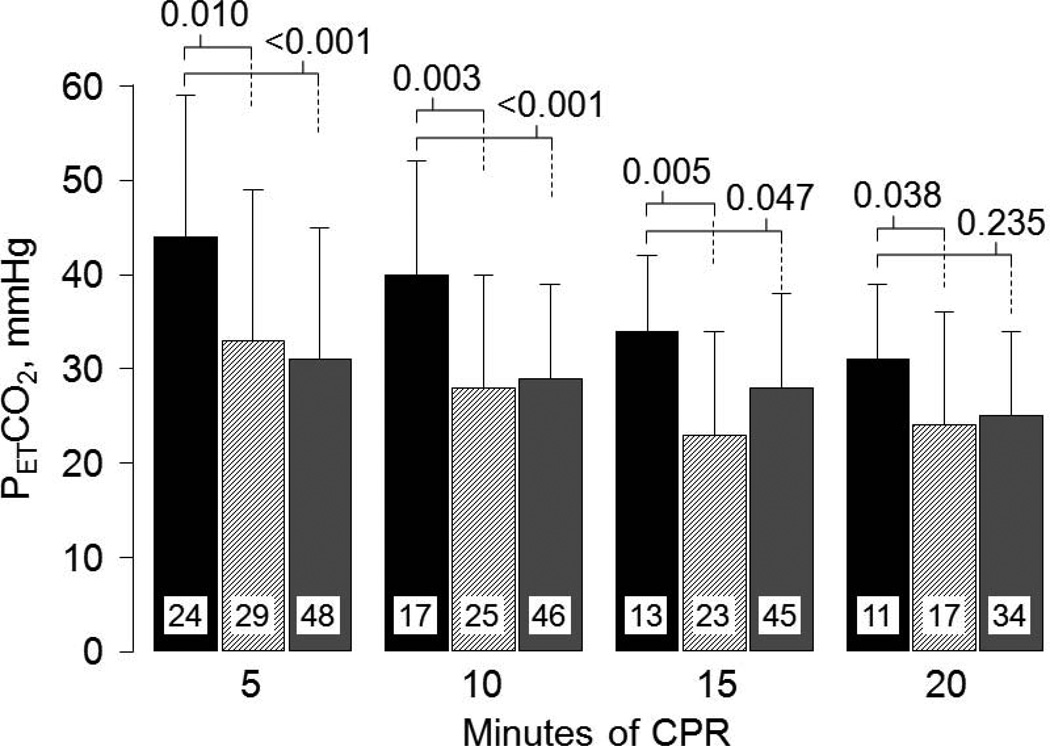
Figure 14.
End-tidal PCO2 (PETCO2) during cardiopulmonary resuscitation in patients who received erythropoietin (black bars, n = 24) compared with concurrent controls (hatched bars, n = 30) and with matched controls (gray bars, n = 48). Numbers inside bars denote patients remaining in cardiac arrest and receiving CPR. Data are presented as mean values with one standard deviation. P-values were calculated by unpaired t-test or by Mann-Whitney rank sum test for each time period and shown above bars (Adapted from Grmec S et al. Resuscitation 2009;80:631).

