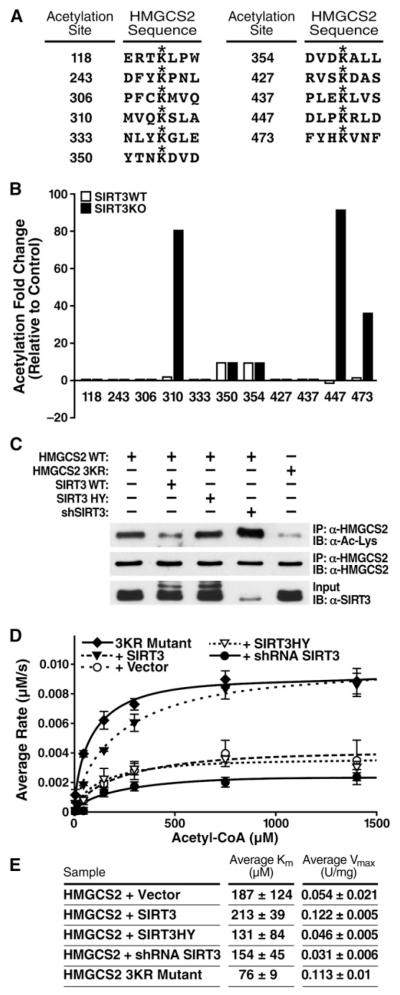
Figure 2. HMGCS2 Acetylation at Lysines 310, 447, and 473 Regulate Activity.
(A) Sites of HMGCS2 acetylation identified by mass spectrometry of purified mitochondria from WT and SIRT3KO mice.
(B) Differential acetylation fold values for HMGCS2 acetylated lysines from WT and SIRT3KO hepatic mouse mitochondria compared to a separate standard mouse reference.
(C) Expression vectors for WT HMGCS2 were transfected into HEK293 cells with an empty vector control; SIRT3-HA; SIRT3-H248Y-HA; pSicoRMS2 shSIRT3; or HMGCS2-K310, −447, −473R (3KR), and the levels of acetylation were assessed.
(D and E) Steady-state kinetic analysis of HMGCS2 activity; rates of HMGCS2 activity were determined as a function of (acetyl-CoA), as measured by DTNB detection of CoASH; 1 unit = 1 μmol substrate converted to product per minute, n = 2–3 measurements/sample, ± SEM, curve is representative of two independent experiments.

