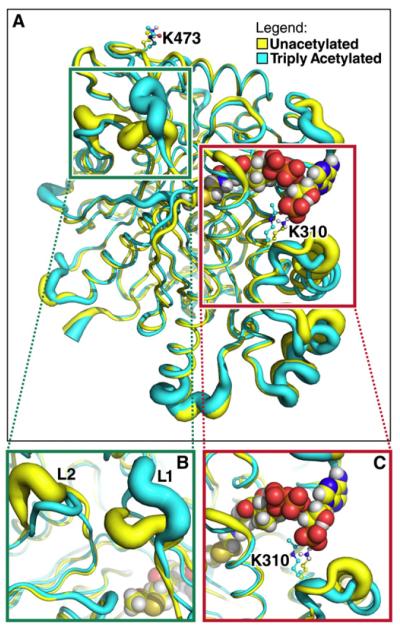
Figure 3. Lysine Deacetylation Affects HMGCS2 Conformation and Dynamics.
The tubes represent the average backbone conformation of the protein over the last 5 ns of five independent simulations, and the widths of the tubes represent the fluctuations from the average conformation (i.e., thicker lines indicate increased conformational flexibility).
(A) Overview of the entire structure for the unacetylated (yellow) and triply acetylated (cyan) mouse HMGCS2. Acetyl-CoA in the model is shown using spheres, whereas K310, K447, K473, and their acetylated forms are shown as balls and sticks.
(B) Closer view of the region around a distal portion of the active site (the green box in A). The two loops showing significant conformational and dynamical changes are labeled L1 (residues 242–251) and L2 (residues 131–140).
(C) Closer view of the region around K310 (the red box in A).

