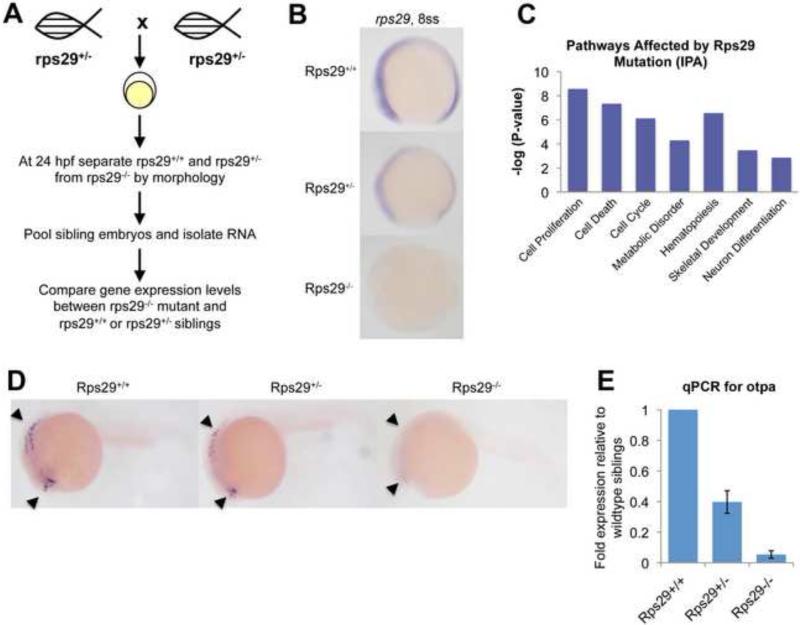
Figure 2. Rps29 mutant microarray reveals dose-dependent genes.
(A) Microarray schematic. Rps29+/- fish were incrossed, and mutant embryos were sorted at 24 hpf. RNA was isolated from sibling embryos and mutant embryos for microarray.
(B) Rps29 expression at the 8 somite stage by whole mount ISH.
(C) Pathways significantly affected in the rps29 mutant, identified by Ingenuity Pathway Analysis.
(D) Dose-dependent expression of otpa. Orthopedia protein a (otpa) levels were assayed by ISH at 24 hpf. Expression can be seen in the telencephalon and hindbrain.
(E) RT-PCR for otpa. Data shown are fold changes of expression in rps29+/- and rps29-/- embryos compared to wildtype siblings at 24 hpf.

