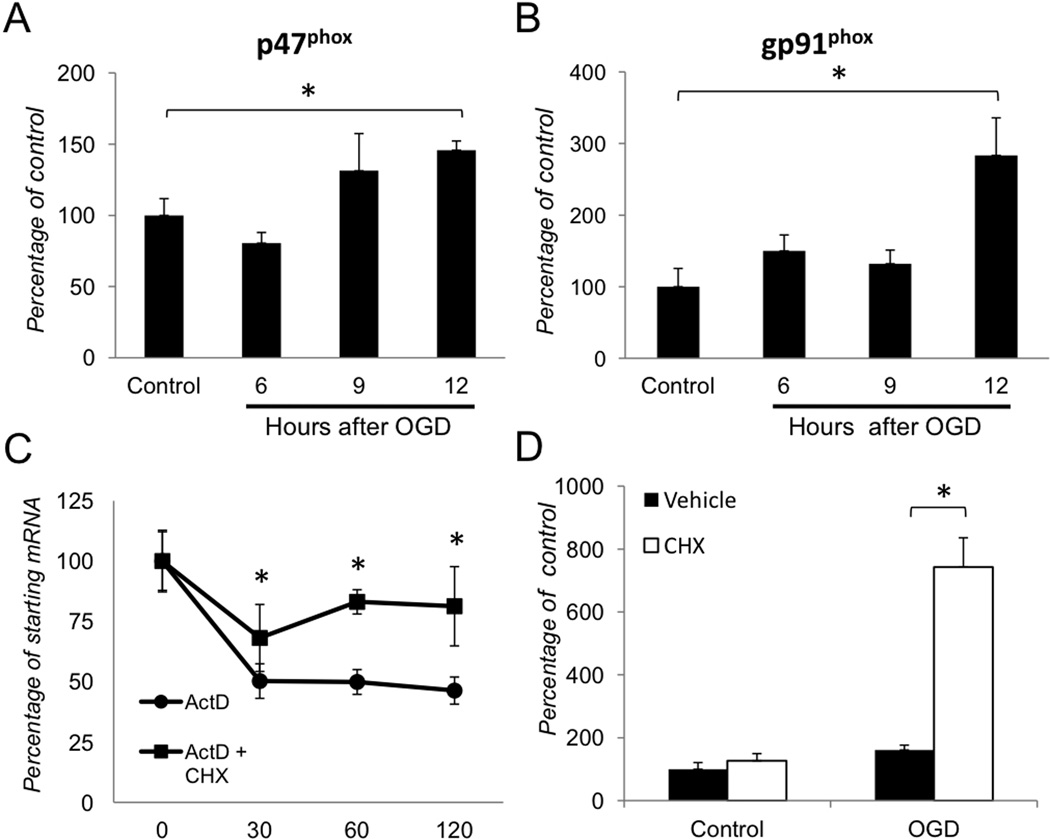
Figure 3. Transcriptional regulation of NADPH oxidase following OGD in primary astrocytes.
(A–B) Gene expression analysis of the p47PHOX and gp91PHOX genes 6, 9 and 12 hours after OGD challenge. Changes were calculated as percentages of untreated control (Control) value. (C) Analysis of p47PHOXmRNA decay in actinomysin D (5µg/ml) treated cells with or without cycloheximide (5µg/ml) 12 hours after OGD treatment. (D) Relative abundance of p47PHOX transcript levels in astrocytes treated with vehicle or cycloheximide (5µg/ml). Gene expression levels were normalized to β-actin. Values are means ± SEM, n=4 and *p<0.05.

