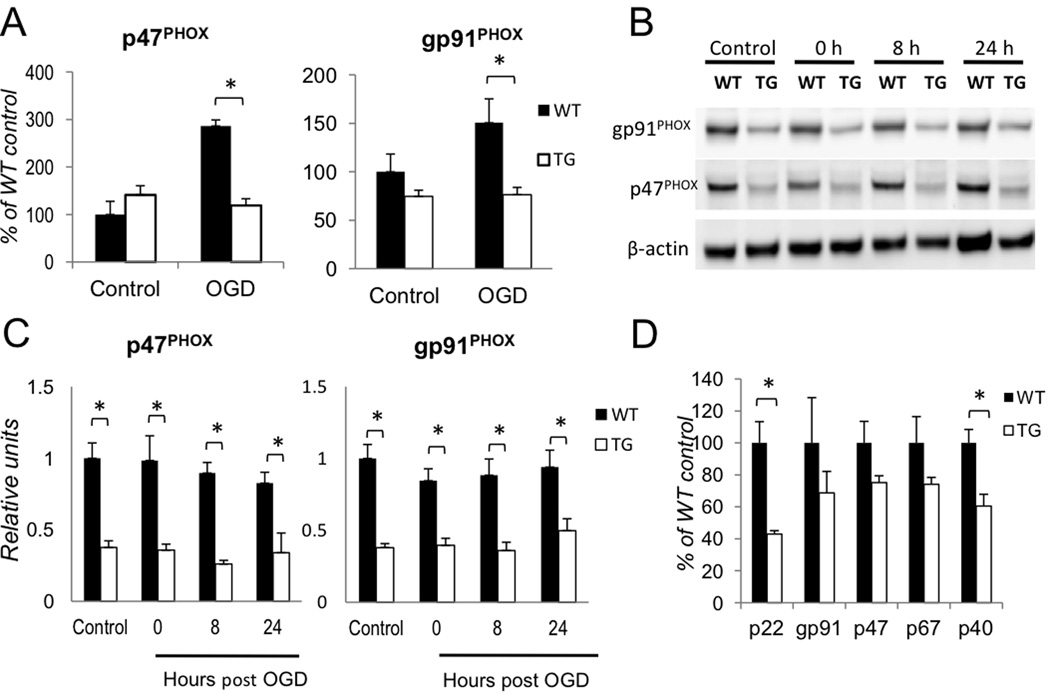
Figure 4. Regulation of homeostatic levels of PHOX is NF-κB dependent.
(A) Gene expression analysis of gp91PHOX and p47PHOX transcripts 12 hours after OGD. Changes were calculated as percentages of untreated WT control (Control) values (n=5, *p<0.05). (B) Time course analysis of gp91PHOXand p47PHOXprotein levels after OGD by quantitative western blot. (C) Quantification of the data shown in (B): the gp91PHOX and p47PHOX band intensities were normalized to β-actin (n=3, *p<0.05). (D) Relative expression levels of genes encoding PHOX subunit in untreated WT and TG astrocytes (n=5; p<0.01).

