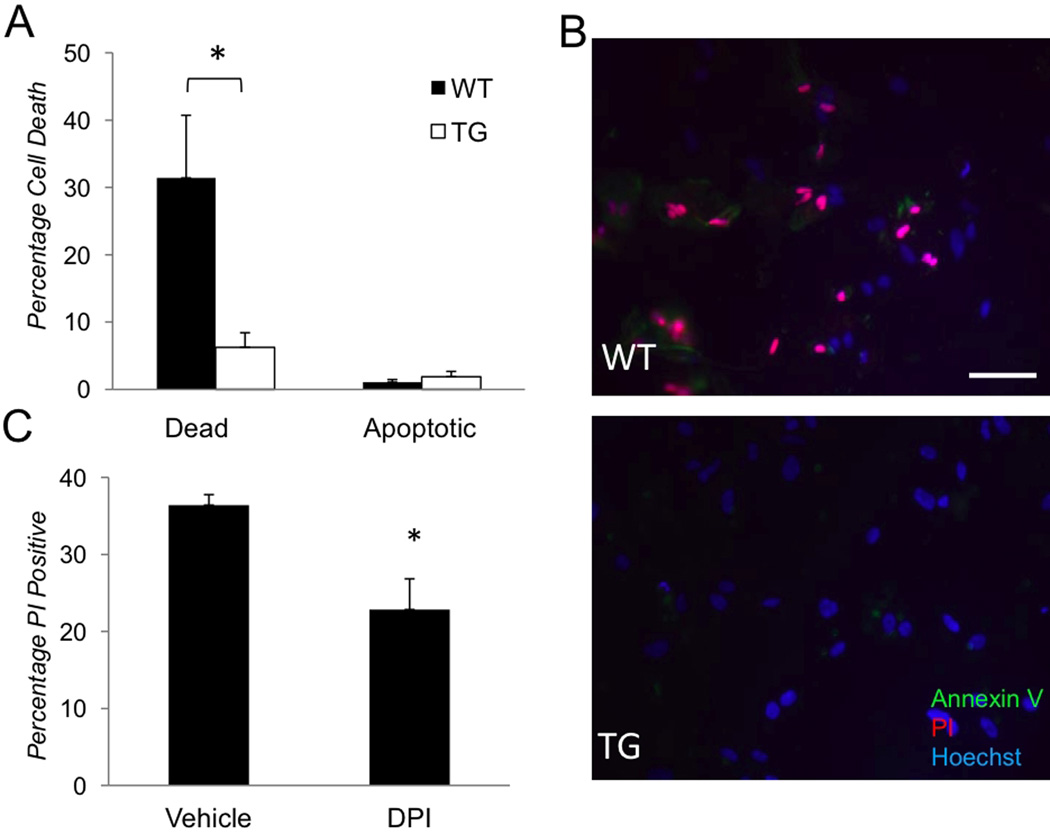
Figure 6. The effects of NF-κB and PHOX suppression on OGD-induced cell death in primary astrocytes.
(A–B) Cell death rates in cultures determined by quantification of cells with PI (red) and AnnexinV (green) labeling 24 hours after OGD (n=3, *p<0.05). (B) Representative images from experiment A showing abundant dead (PI-positive or PI/AnnexinV-positive) cells in WT but not in TG cultures; Hoechst dye (blue) labels nuclei for total cell counts. (C) Cell death rates (% of PI- positive among Hoechst- positive) cells in vehicle-treated control and 1µM DPI-treated astrocytes cultures 24 hours after OGD (n=4, *p<0.05). Scale bar 50µm.

