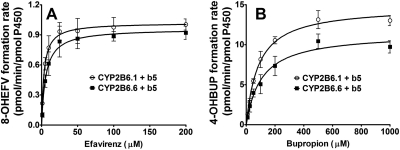
Fig. 3.
Efavirenz concentrations versus formation rate of 8-hydroxyefavirenz (A) and bupropion concentrations versus formation rate of 4-hydroxybupropion (B) in microsomes containing cDNA-expressed CYP2B6.1 and CYP2B6.6 with coexpression of Cyt b5. Efavirenz (1–200 μM) or bupropion (10–1000 μM) was incubated with reconstituted systems containing either CYP2B6.1 or CYP2B6.6 with coexpression of Cyt b5 (15 pmol) and a NADPH-generating system for 15 min at 37°C. The formation rate of 8-hydroxyefavirenz and 4-hydroxybupropion (pmol/min/pmol P450) versus substrate concentrations were fit to the simple single-site Michaelis-Menten equation. Each point represents mean ± S.D. of three replicates. 8-OHEFV, 8-hydroxyefavirenz; 4-OHBUP, 4-hydroxybupropion.

