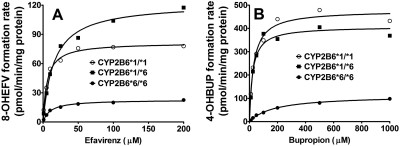
Fig. 4.
Efavirenz concentrations versus formation rate of 8-hydroxyefavirenz (A) and bupropion concentrations versus formation rate of 4-hydroxybupropion (B) in 15 human liver microsomal samples with CYP2B6*1/*1, CYP2B6*1/*6, and CYP2B6*6/*6 genotypes (n = 5 HLMs for each genotype). Efavirenz (1–200 μM) or bupropion (10–1000 μM) was incubated with human liver microsomal samples (0.25 mg/ml) with CYP2B6*1/*1, CYP2B*1/*6, and CYP2B*6/*6 genotypes (n = 5 HLMs for each genotype) and a NADPH-generating system for 15 min at 37°C in duplicate. The formation rate of 8-hydroxyefavirenz and 4-hydroxybupropion (pmol/min/mg protein) versus substrate concentrations were fit to the simple single-site Michaelis-Menten equation. Each point represented as the average of five individual incubations in human liver microsomal samples with the same CYP2B6 genotype. 8-OHEFV, 8-hydroxyefavirenz; 4-OHBUP, 4-hydroxybupropion.

