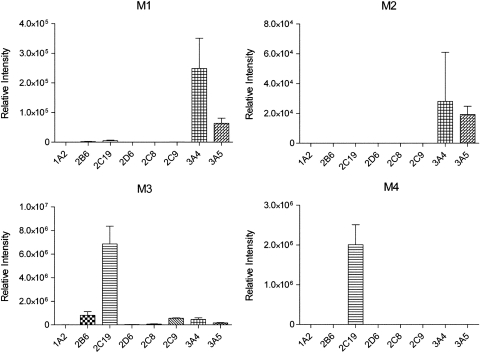
Fig. 3.
Contribution of individual P450s to the formation of ETR metabolites. Individual cDNA-expressed P450s (10 pmol) were incubated with 20 μM ETR for 30 min at 37°C in the presence of an NADPH-regenerating system. Metabolite formation was monitored using UPLC-MS in multiple reaction monitoring mode as described under Materials and Methods. The data are presented as the mean relative peak intensities ± S.D. for three separate experiments.

