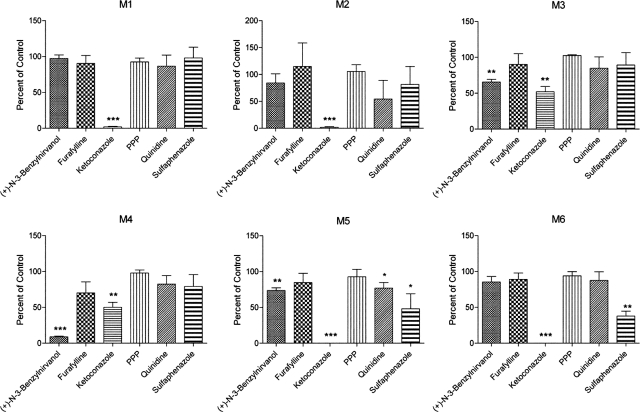
Fig. 5.
Effect of chemical inhibition of individual P450s in HLMs on ETR metabolite formation. HLMs (0.5 mg/ml) were incubated with 20 μM ETR for 30 min at 37°C in the presence of the following P450 inhibitors: 10 μM (+)-N-3-benzylnirvanol (CYP2C19 inhibitor), 20 μM furafylline (CYP1A2 inhibitor), 1 μM ketoconazole (CYP3A4 inhibitor), 30 μM PPP (CYP2B6 inhibitor), 1 μM quinidine (CYP2D6 inhibitor), and 20 μM sulfaphenazole (CYP2C9 inhibitor). Formation of the oxidative metabolites of ETR was then measured using UPLC-MS analysis as described under Materials and Methods. Data are presented as percentages of control sample formation (solvent alone) and represent the means ± S.D. of three separate experiments. Statistical significance was determined by performing a Student's t test. *, p < 0.05; **, p < 0.01; ***, p < 0.001.

