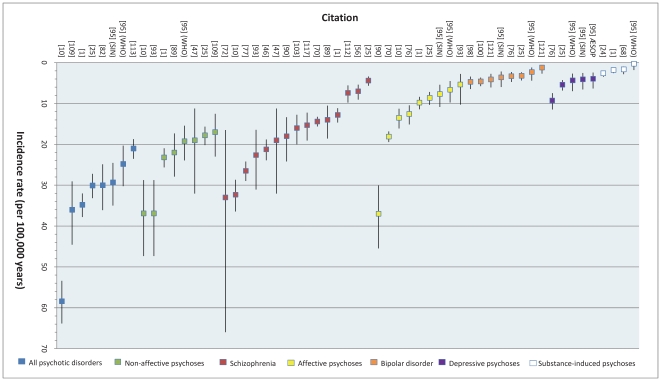
Figure 2. Reported overall incidence of various psychotic disorders in England, 1950–2009.
The incidence of different psychotic disorders is plotted for each citation which contributed a primary rate for analysis. As the diagnostic category moves from broader (i.e. all psychotic disorders) to narrower diagnostic conditions (i.e. schizophrenia, bipolar disorder) incidence rates tend to decrease. This figure also reveals absolute differences in rates between certain conditions, for example schizophrenia vs. bipolar disorder. One identified point estimate is not shown [101] because it pertained only to rates up to age 35 years. Remaining estimates cover the full adult age range, typically until the mid-sixties.

