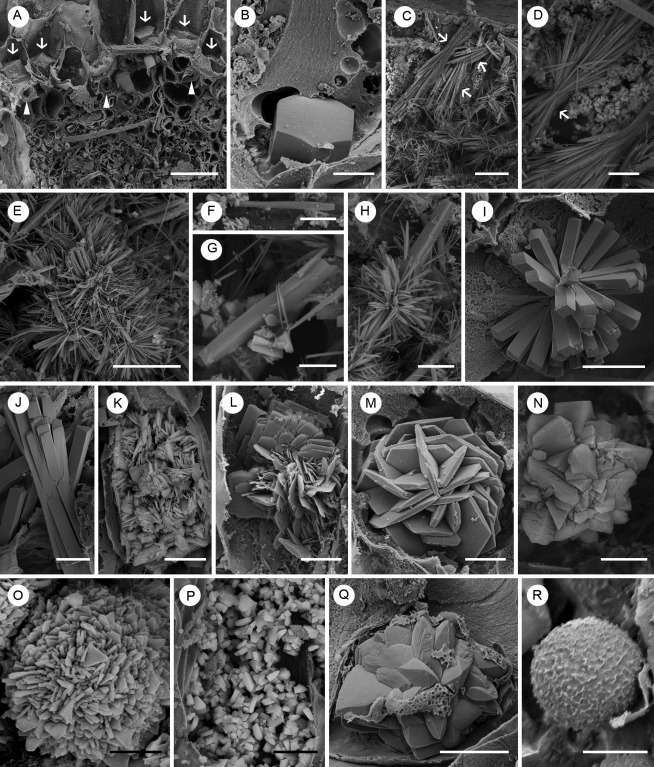
Fig. 2.
SEM images of various crystals in a phyllode of Acacia robeorum. (A) Several prismatic crystals (arrows) associated with phloem fibre cells (arrowheads). (B) A single hexagonal prismatic crystal. (C) Bundles of raphides with similar orientations (arrows) in the mesophyll. (D) A bundle of raphides with similar orientations (arrow) in the parenchyma. (E) Raphides with different orientations developing from the same nucleation site in the parenchyma. (F) A solitary styloid in the mesophyll. (G) A styloid with two raphides in the parenchyma. (H) A styloid with numerous raphides in the parenchyma. (I) A styloid druse in a parenchyma cell. (J) A bundle of crystals which are intermediate forms of styloid and raphide in the mesophyll. (K) A platy aggregation cluster which occupied almost a whole mesophyll cell. (L) A platy aggregation cluster in a mesophyll cell. (M) A tabular crystal druse in a parenchyma cell. (N) A blocky and tabular crystal druse in a mesophyll cell. (O) A platy crystal druse in a parenchyma cell. (P) Crystal sand in a mesophyll cell. (Q) A tetrahedral crystal druse in a parenchyma cell. (R) A spherical crystal in a parenchyma cell. Scale bars: (A, D, F, G) = 20 µm; (B, I, K, P, Q) = 10 µm; (C, E) = 50 µm; (H) = 25 µm; (J, L–O) = 5 µm; (R) = 2 µm.

