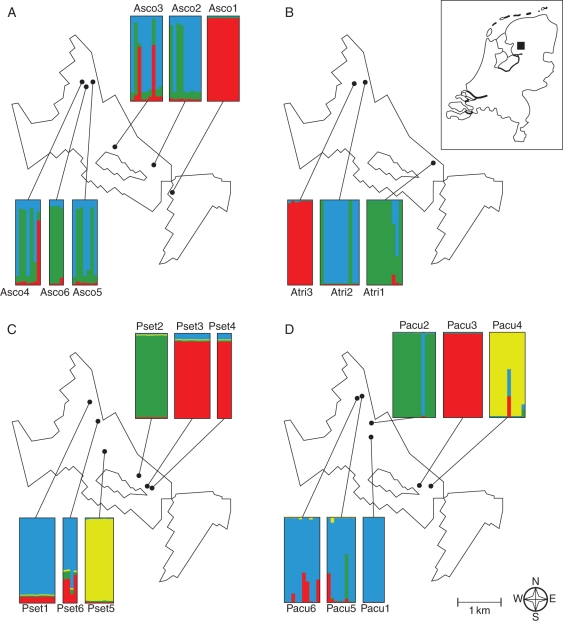
Fig. 1.
Maps of the Kuinderbos, showing the position of each sampled population, along with the assignment of individual samples to K different gene pools as inferred by Bayesian clustering analysis. Per population, each individual is represented by a vertical bar, in which different colours show the proportional membership in each gene pool. The inferred value of K varies per species. (A) Asplenium scolopendrium (K = 3), (B) Asplenium trichomanes (K = 3), (C) Polystichum setiferum (K = 4), (D) Polystichum aculeatum (K = 4). The inlay in the right upper corner shows the position of the Kuinderbos (black square) within The Netherlands.

