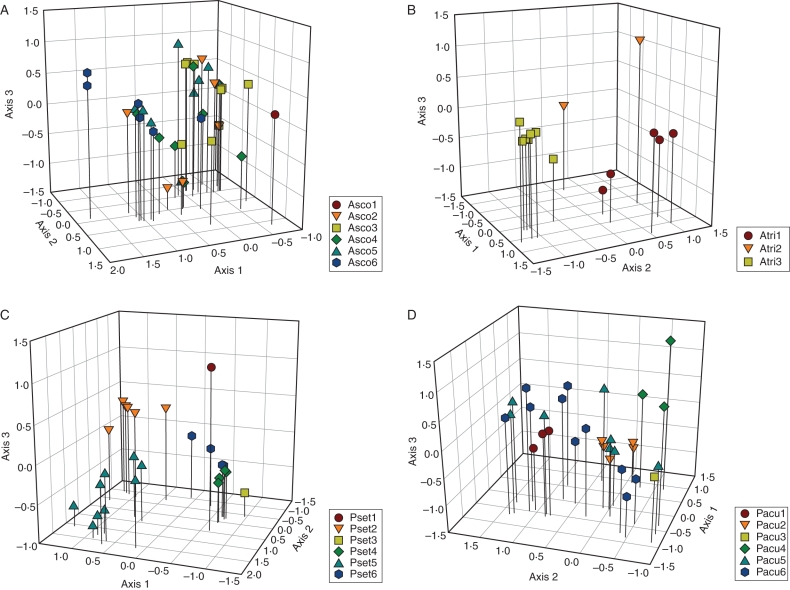
Fig. 2.
Principal components analysis (PCA) based on presence data per allele per locus. Position along the first three principle components is plotted for each genotyped individual. Note that individuals with the same multilocus genotype overlap each other in the plot. Different colours represent different populations. (A) Asplenium scolopendrium, (B) Asplenium trichomanes, (C) Polystichum setiferum, (D) Polystichum aculeatum. The cumulative percentage of variation explained by the first three components was 48·5, 83·5, 66·9 and 59·4 %, respectively, for the four species.

