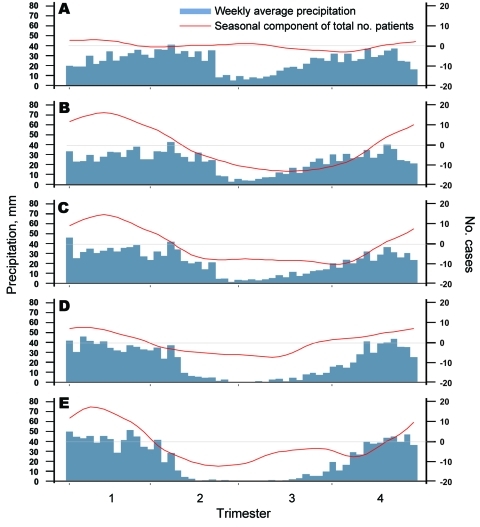
Figure 4.
Seasonal patterns/components of cholera outbreaks for 5 hotspots in the African Great Lakes region, 2002–2008. Hotspots are Goma (A), Bukavu (B), Uvira (C), Kalemie (D), and Upper Congo Basin (E). Blue indicates the weekly average precipitation (in mm); red indicates the seasonal component of the total number of patients after the time series was decomposed into a trend and seasonal and residual components by using a seasonal-trend decomposition procedure based on loess regression. Horizontal gray lines indicate seasonal component = 0.

