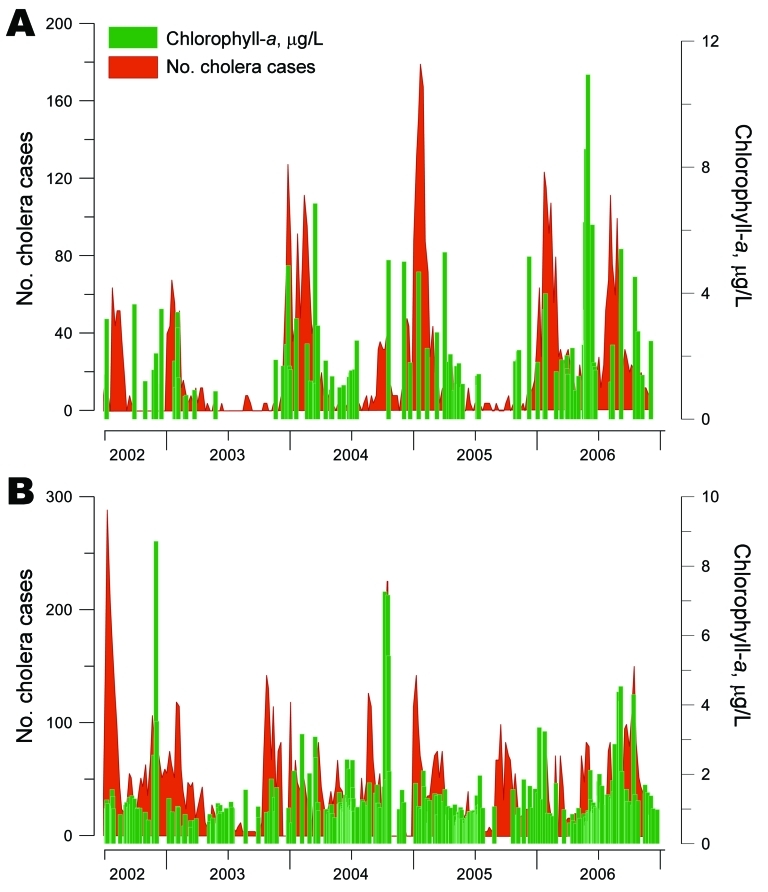
Figure 5.
Link between the number of cholera cases and fluctuations in phytoplankton abundance (chlorophyll-a concentrations) in Lake Tanganyika, Africa Great Lakes region, January 2002–December 2006. Two of 5 cholera hotspots in the region were tested, both of which face Lake Tanganyika: Uvira (A) and Kalemie (B). Green indicates median concentrations of chlorophyll-a in surface water; red indicates cholera cases.

