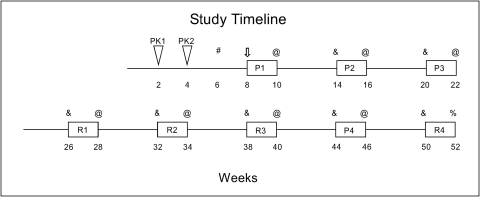
Fig. 1.
A schematic of the study time line. The time in weeks is shown below the timeline. The timing of the two pharmacokinetic studies is indicated by the triangles PK1 and PK2. The drug dosing periods are indicated by rectangles labeled R or P for risperidone and paliperidone treatment, respectively, with the numbers after the letters indicating the dose of drug administered (e.g., R1 indicates the lowest dose of risperidone, 0.025 mg/kg/day). #, when each animal received an MRI and baseline PET scan. ⇓, when each animal underwent gastric catheter surgery and drug pump placement. @, when each animal underwent blood and CSF collection and an on-drug PET scan followed by replacement of drug pump for a saline pump. &, when each animal underwent an off-drug PET scan followed by replacement of saline pump for a drug pump. %, when each animal underwent blood and CSF collection and an on-drug PET scan followed by sacrifice.

