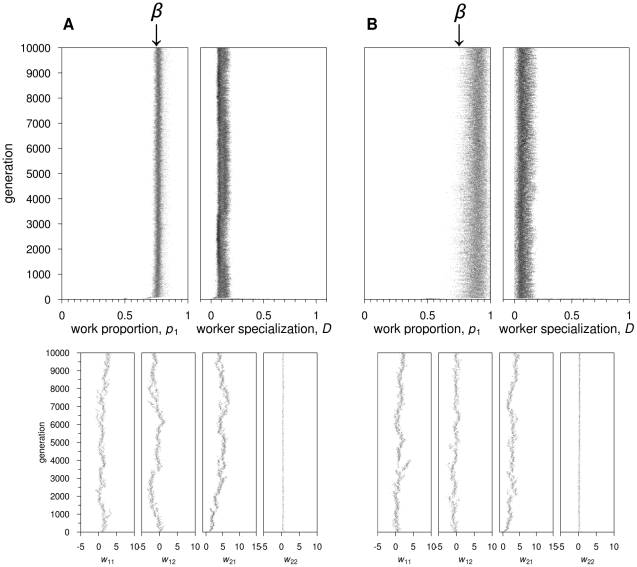
Figure 4. Feedforward neural networks: Evolutionary dynamics for two representative simulations, where.
 and
and
 . The same graphic conventions as in Figure 2 are followed. (A)
  . Top graphs:
  increases to the optimal value 0.75; specialization remains low. Bottom graphs: connection weights incoming at output node 1 become positive (strongest connection weight being
  ); connection weights incoming at output node 2 become negative (
 ) or positive, but very close to zero (
 ). (B)
  . Top graphs:
 increases to values above 0.75;
  remains low. Bottom graphs: similar to when
  , but
, but  is closer to zero.

