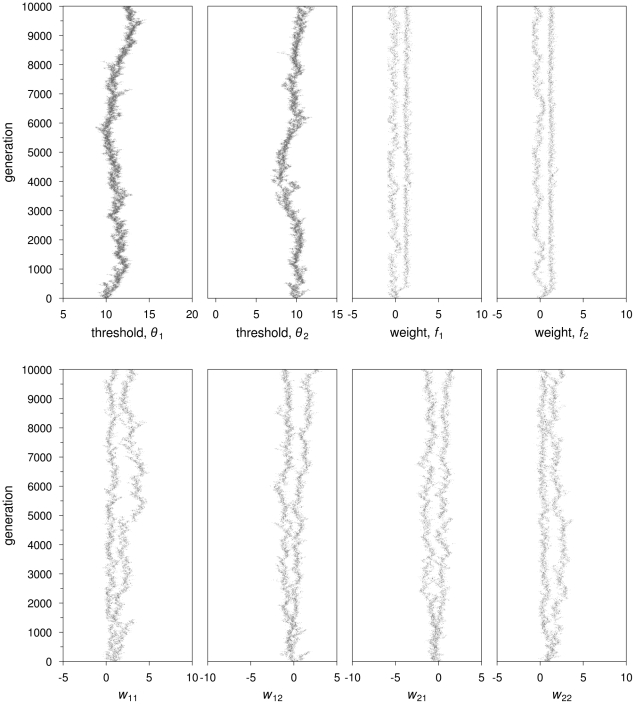
Figure 7. Recurrent neural networks: Evolutionary trajectories of network parameters leading to genetically-determined specialization.
A simulation is shown in which only half of the colonies in the population evolve a high degree of specialization. Parameter values as in figure 6. All connection weights undergo evolutionary branching. The self-feedback ( and
and  ) and crossed connection weights (
 and
and  ) show one branch with negative values and the other with positive values. The other connection weights show one branch close to zero and the other larger, positive values.

