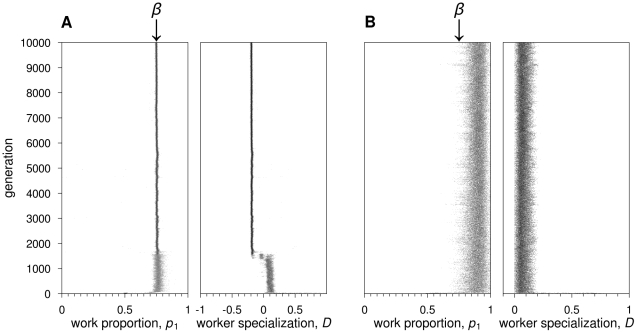
Figure 8. Recurrent neural networks: Evolutionary dynamics of work distribution.
 and worker specialisation
 for
for
 and
and
 . (A)
. (A)  .
.  quickly reaches the optimal value 0.75.
  evolves to negative values, indicating that individuals switch tasks more often than by chance. (B)
  .
.  increases to values above 0.75; worker specialization does not evolve.

