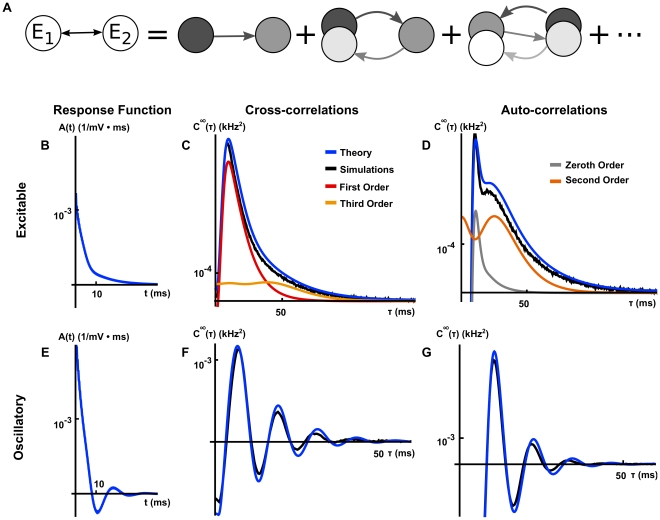
Figure 4. The relation between correlation structure and response statistics for two bidirectionally coupled, excitatory cells.
(A) The cross-correlation between the two cells can be represented in terms of contributions from an infinite sequence of submotifs (See Eq. (20)). Though we show only a few “chain” motifs in one direction, one should note that there will also be contributions to the cross-correlation from chain motifs in the reverse direction in addition to indirect common input motifs (See the discussion of Figure 5). (B), (E) Linear response kernels in the excitable (B) and oscillatory (E) regimes. (C), (F) The cross-correlation function computed from simulations and theoretical predictions with first and third order contributions computed using Eq. (19) in the excitable (C) and oscillatory (F) regimes. (D), (G) The auto-correlation function computed from simulations and theoretical predictions with zeroth and second order contributions computed using Eq. (19) in the excitable (D) and oscillatory (G) regimes. In the oscillatory regime, higher order contributions were small relative to first order contributions and are therefore not shown. The network's symmetry implies that cross-correlations are symmetric, and we only show them for positive times. Connection strengths were  . The long window correlation coefficient
  between the two cells was
  in the excitable regime and
  in the oscillatory regime. The ISI CV was approximately 0.98 for neurons in the excitable regime and 0.31 for neurons in the oscillatory regime.

