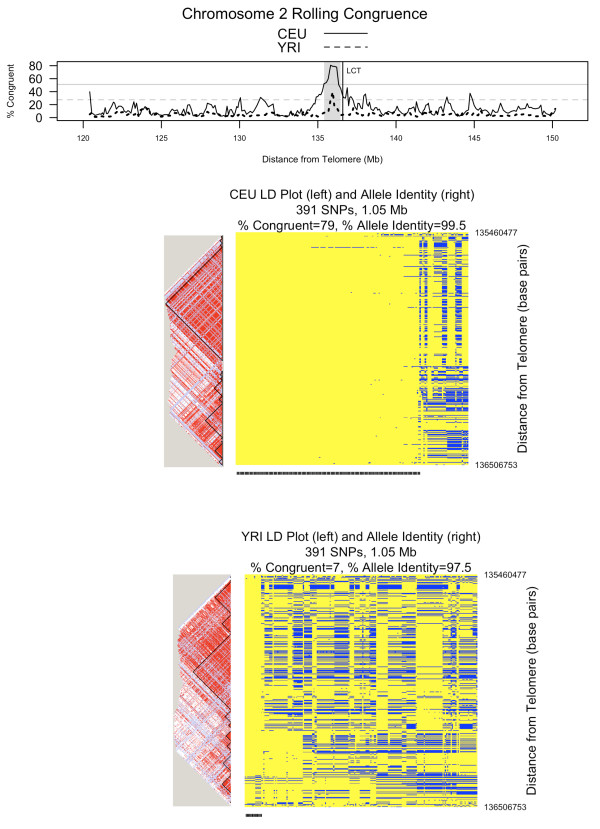
Figure 5.
Comparing unrelated HapMap populations: chromosome 2. This figure shows rolling congruence over a section of chromosome 2. Detailed linkage disequilibrium (LD) plots with haplotype blocks and allele identity plots correspond to the shaded peak. The two horizontal reference lines on the rolling congruence plot correspond to the 99th percentile of congruence observations across the genome. That value is 51.1% for CEU (solid line) and 27.5% for YRI (dotted line). On the LD plots, shades of red indicate increasing D'. For the allele identity plots, each column is one chromosome (as represented by 391 SNPs and 1.05 Mb) and each row is a SNP. Yellow represents alleles that match the consensus sequence whereas blue represents alleles that do not match the consensus. Congruent chromosomes are indicated by the tick mark at the bottom of the allele identity plot. This peak on chromosome 2 represents a region where CEU chromosomes are more congruent than YRI chromosomes and is near the LCT gene, previously implicated as a target of recent positive selection

