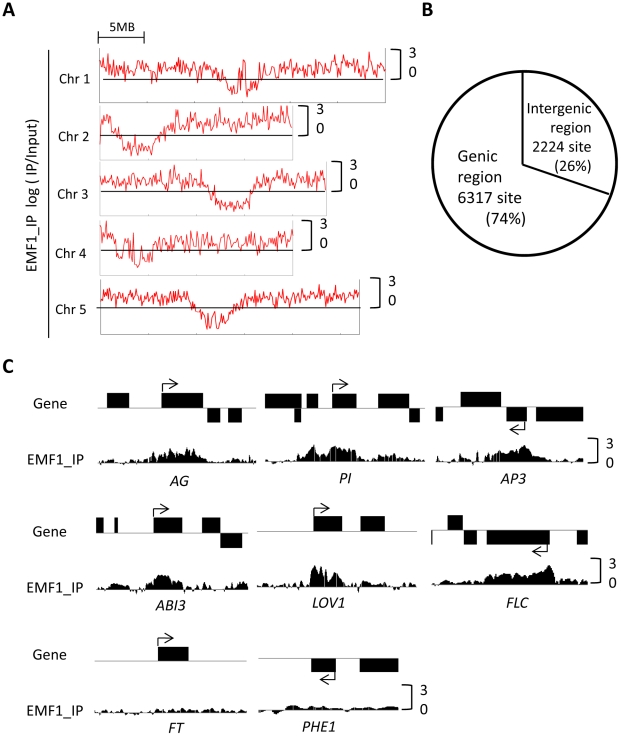
Figure 1. Genome-wide EMF1 binding map.
(A) Chromosomal distribution of EMF1 binding sites. EMF1 binding regions per 100 kb on the 5 Arabidopsis chromosomes. Chr and 5MB represent chromosome and 5 megabase, respectively. Y-axis represents log2-ratio of the input signals for the immunoprecipitated DNA (IP/input). (B) EMF1 binding sites in genic and intergenic regions. (C) EMF1 binding pattern on Arabidopsis genes. Consistent with ChIP-PCR results [34], [36], PI, AG, AP3, ABI3, LOV1, and FLC chromatin is enriched with EMF1-3FLAG signal, but not FT and PHE1. Black box represents gene body and arrow indicates transcription start site (TSS) and transcriptional direction.

