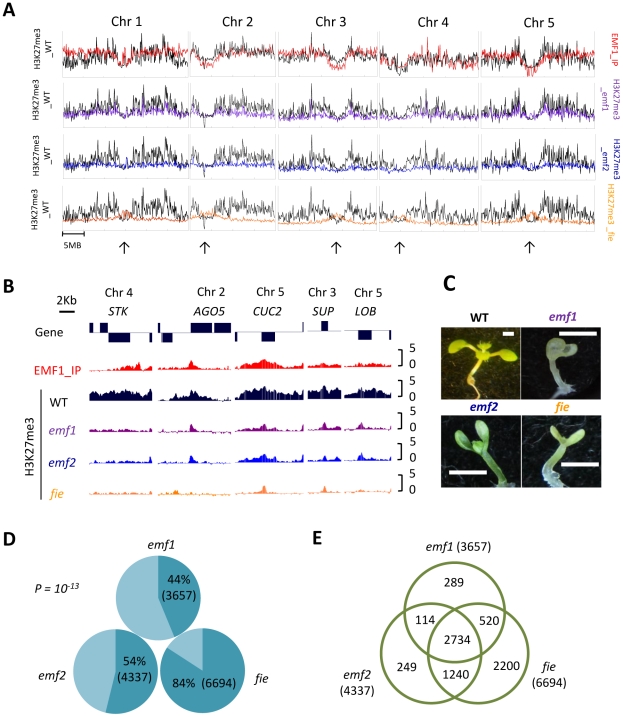
Figure 2. Chromosomal distribution of EMF1 binding sites and H3K27me3 modified regions in WT and 3 mutants.
(A) Top panel shows the comparison of H3K27me3 marked (black) and EMF1 binding (red) regions per 100 kb in WT on 5 chromosomes. Lower three panels show comparison of H3K27me3 in WT and three mutants (purple: emf1; blue: emf2; orange: fie). Arrows point at pericentromeric locations. (B) H3K27me3 and EMF1 binding patterns (EMF1_IP) on individual genes in WT and 3 mutants. STK: SEEDSTICK, AGO5: ARGONAUTE5, CUC2: CUP-SHAPED COTYLEDON2, SUP: SUPERMAN, LOB: LATERAL ORGAN BOUNDARIES. (C) WT and mutants grown at short day condition for 15 days. (D) The percentage of 7,751 H3K27 trimethylated genes showing reduced methylation in mutants. 44%, 54% and 84% of the H3K27me3 marked genes in WT show reduced methylation in emf1, emf2 and fie mutants, respectively. The p-value is 10−13. (E) Venn diagram showing number of genes with reduced methylation that overlaps.

