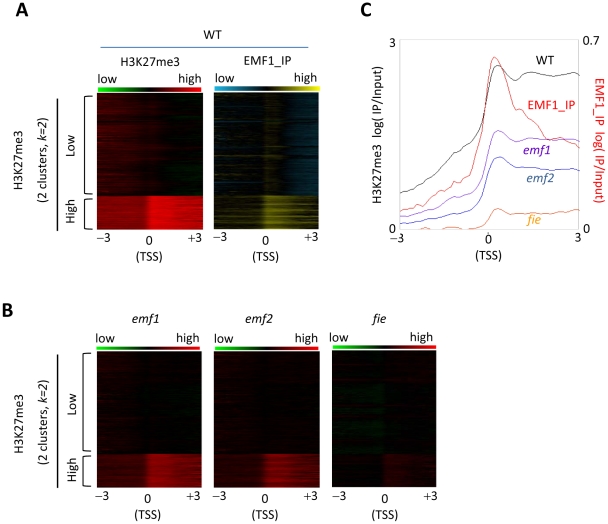
Figure 3. H3K27me3 modification and EMF1 binding pattern in genes of high and low H3K27 trimethylation levels.
(A) Heat map of H3K27me3 and EMF1 binding patterns of the entire WT genome. All annotated sequences from the TAIR8 were aligned at the TSS and average signals for each 100 bp bin were plotted from 3 kb upstream of the TSS to 3 kb into the gene. Average H3K27me3 signal in each 100 bp bin in WT was calculated, and data sorted into two groups by an unsupervised k-means clustering algorithm (k = 2) and displayed as a heat map. The cluster of genes with highly trimethylated gene body is indicated with ‘High’ and the cluster of genes with low trimethylation in the gene body is indicated with ‘Low’. The left panel displays the H3K27me3 pattern, while the right panel displays EMF1 binding (EMF1_IP) dataset aligned according to the two clusters of H3K27me3 genes. (B) Heat map of H3K27me3 in three mutants. The H3K27me3 dataset of emf1, emf2, and fie were aligned according to the sorting order of H3K27me3 of WT. (C) The pattern of H3K27me3 in WT, emf1, emf2 and fie, and EMF1 binding in WT in the cluster of highly trimethylated genes. The sequences of the genes with high H3K27me3 were aligned at TSS and average signals for each 100 bp bin were plotted from 3 kb upstream of the TSS to 3 kb into the gene.

