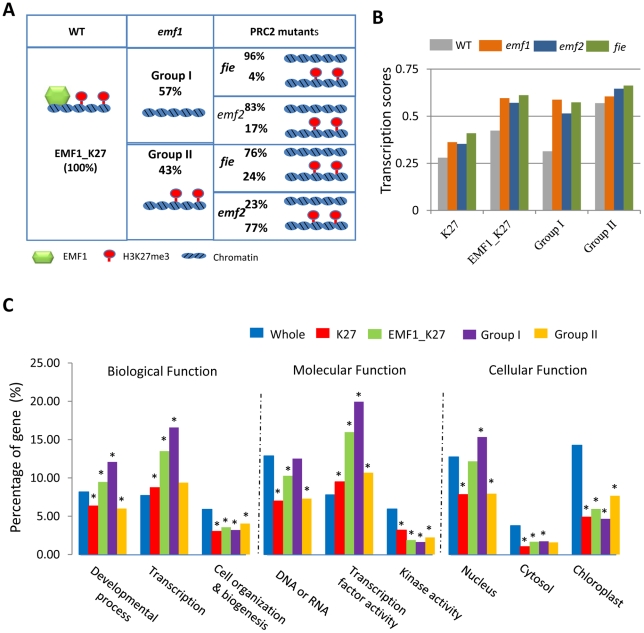
Figure 5. Functional analysis of groups of genes based on EMF1 binding and H3K27me3.
(A) H3K27me3 status of EMF1-bound genes in emf1 and PRC2 mutants. In WT, 3,230 (100%) were EMF1-bound and trimethylated on H3K27 (EMF1_K27). Among them, 1,845 or 57% of the EMF1_K27 genes, Group I, showed reduced H3K27me3 in emf1 mutant. Among the 1,845, 1,536 (83%) and 1,783 (96%) showed reduced H3K27me3 in emf2 and fie mutants, respectively. 17% and 4%, however, were trimethylated in fie and emf2, respectively. 1,385 or 43% of EMF1_K27 genes, Group II, remained trimethylated in emf1. Among the 1,385 genes remained trimethylated in emf1, 24% and 83% also maintained, while 76% and 17% showed reduced, methylation in fie and emf2, respectively. (B) Average transcriptional score of genes of H3K27 trimethylated (K27), EMF1_K27, Group I, and II in WT and 3 mutants. Each feature or hybridization signal on the NimbleGen array is represented as log2-ratio of the genomic DNA for the amplified cDNA from the sample. After median normalization, each feature was annotated and scored using perl scripts to produce the transcription score. Y- axis: arbitrary units representing average transcription scores [log2 (mRNA signal intensity)] for genes in given groups. (C) Gene ontology (GO) annotation analysis. Percent representation of whole genome (whole), trimethylated (K27), EMF1_K27, Group I, and Group II based on the 9 GO categories, 3 in each of the biological, molecular and cellular functional category is detailed in Table S5. Y-axis: the percentages of genes in each GO category. Categories marked with “*” have a p-value<10−3.

