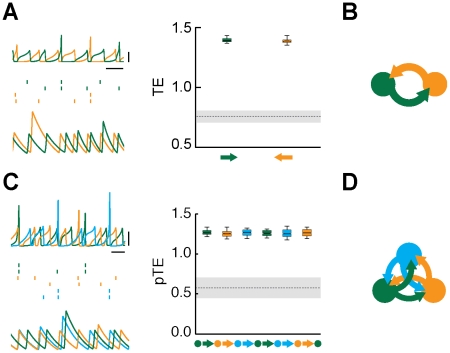
Figure 5. Effective motifs of the mutual driving family.
The figure shows dynamics and corresponding effective connectivities for fully symmetric structural motifs with  (panels A–B) or
  (panels C–D) areas, for large inter-areal coupling strength, leading to symmetrically irregular oscillations, without a stable phase relation. A: the dynamics of
  interacting areas (green and orange colors) is illustrated by “LFPs” (left, top row) and representative spike trains (left, middle row, two cells per each area) from the network model (horizontal bar is
  , vertical bar is
  ), as well as by matching rate traces (left, bottom row) from the rate model (arbitrary time units). The right sub-panel reports the associated effective connectivity measured by Transfer Entropy (TE), evaluated from “LFPs” time-series, for all possible directed interactions (indicated by colored arrows). Boxes indicate the interquartile range and whiskers the confidence interval for the estimated TEs. TEs above the grey horizontal band indicate statistically significant causal influences (see
Methods
). B: to the right of the corresponding box-plot, effective connectivity is also represented in a diagrammatic form. Arrow thicknesses encode the strength of corresponding causal interactions (if statistically significant). A single motif is included in this family The parameters used for
  are, for the network model:
  ,
,  ; and for the rate model:
  ,
,  ,
,  . C: this panels reports similar quantities as panel A, but now for a structural motif with
  areas (green, orange and light blue colors). Effective connectivity is measured by partialized Transfer Entropy (pTE; see
Methods
), in order to account for direct but not for indirect causal interactions. D: the mutual driving effective motif for
  is also reported. The parameters used for
  are, for the network model:
  ,
,  ; and for the rate model:
  ,
,  ,
,  .
.

