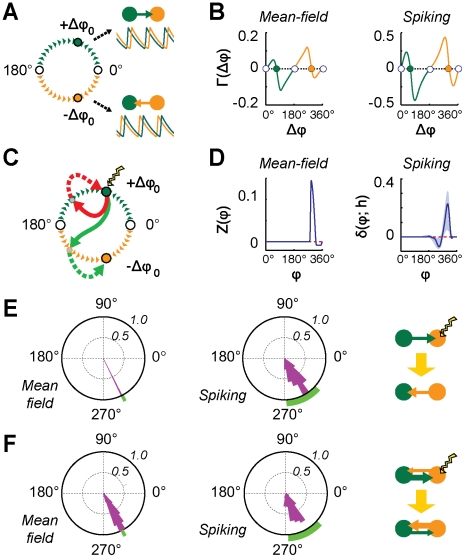
Figure 6. Dynamic control of effective connectivity.
A: symmetric structural motifs can give rise to asymmetric dynamics in which one area leads in phase over the other (spontaneous symmetry breaking). Basins of attraction (in phase-shift space) of distinct phase-locking configurations are schematically shown here (for  ). Empty circles stand for unstable in- and anti-phase lockings and filled circles for stable out-of-phase lockings (corresponding to unidirectional driving effective motifs). B: phase-shift evolution function
  for the rate model (left, analytical solution,
  ) and for the network model (right, numerical evaluation,
  ). Empty and filled circles denote the same stable and unstable phase-lockings as in panel A. C: cartoon of successful (dashed green arrow) and unsuccessful (dashed grey arrow) switchings induced by brief perturbations (lightning icon). An input pulse to the system destabilizes transiently the current phase-locking (solid red and green arrows). For most perturbations, the system does not leave the current basin of attraction and the previous effective motif is restored (dashed red arrow). However, suitable perturbations can lead the system to switch to a different effective motif (dashed green arrow). D: a pulse of strength
  induces a phase advancement of the collective oscillations, depending on its application phase
  , as described by the Phase Response Curve
  (left, rate model; analytical solution,
  ) or by the induced shift
  (right, network model; numerical evaluation,
  ). E–F: frequency histogram of successful switching for pulses applied at different phases (the laggard area is perturbed;
  for the rate model and
  for the network model). Predicted intervals for successful switching are marked in green, for the unidirectional (panel E) and for the leaky effective driving (panel F) motifs (left, rate model; right, network model; parameters as in Figures 3 and 4). Diagrams of the induced transitions are shown in the third column (see SI, Figure S2 for perturbations applied to the leader area).

