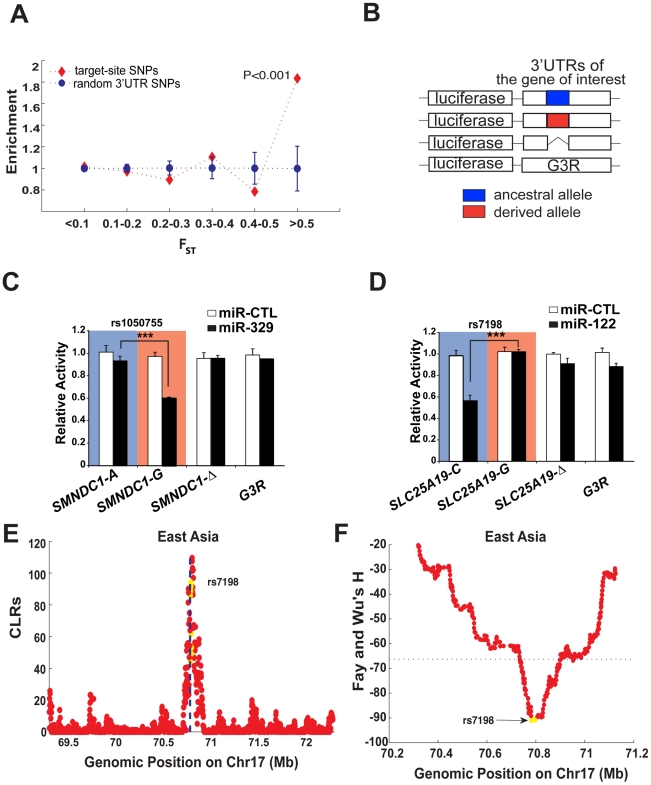
Figure 1. Identification of miRNA binding sites that show extreme population differentiation.
(A) The predicted miRNA binding sites are significantly enriched among the High-FST loci on 3′ UTRs. The enrichment score was the fraction of the target-site SNPs in each bin divided by the fraction of all the 3′ UTR SNPs in the same bin. Likewise the enrichment score for the randomly sampled SNPs in each bin was computed in the same way based on 1, 000 bootstrap resampling from all the 3′ UTR background SNPs. Error bar represents one standard deviation. (B–D) In vitro validation of the predicted miRNA binding sites showing extreme population differentiation. The 3′ UTR of genes selected for validation were cloned into the pMIR-REPORTER vector. Variants of each gene harbouring the ancestral (blue), derived (red) alleles or a deletion of putative miRNA site were generated and analyzed along with the G3R control vector (B). For analysis of miRNA targeting, the reporters containing the indicated ancestral (blue shading) or derived (red shading) alleles of SMNDC1 (C) or SLC25A19 (D), as well as the deletants or the G3R control were transfected into HEK293T cells in the presence of either control miRNA (miR-CTL; white bars) or the relevant miRNA (black bars), as shown. 40-hour post-transfection, luciferase expression in cell lysates was measured by chemiluminescence and is plotted as activity relative to miR-CTL transfected cultures. Bars are the mean ± standard deviation for triplicate experiments and *** indicates P<0.001. (E–F) Statistical tests for positive selection on the miR-122 binding site on SLC25A19 in East Asians (CHB+JPT), where the derived allele of rs7198 that compromises miR-122 regulation has reached high frequency in East Asians. The yellow dots represent genic position on SLC25A19, and the flanking non-genic positions are in red. The CLR test (E, where the dotted line indicates the locus of rs7198) and Fay-Wu's H statistic (F, where the dotted line indicates the 5% extreme value among the genome-wide SNPs) were used.

