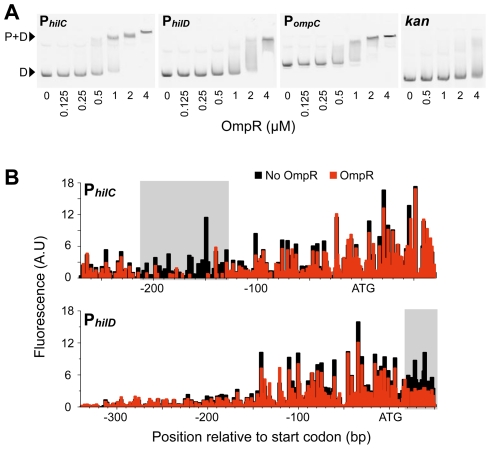
Figure 3. OmpR binding to SPI-1 gene promoters.
A) Bandshifts showing OmpR binding to PhilC and PhilD, as well as to the PompC positive control and the kan gene negative control. D, free DNA; P+D, protein-DNA complexes. B) Footprinting of OmpR binding to PhilC and PhilD using end-labelled linear DNA fragments. The size and quantity of 6-FAM-labelled digestion products were measured using a capillary electrophoresis DNA sequencing instrument.

